The average true range (ATR) is the average size of a market’s daily move, gaps included. On 23 October 2026 it was 0.95% of the price for the S&P 500, 1.8% for Apple and 3.4% for Tesla; for Bitcoin it was 2.7% on 22 October. That makes it a good ruler for sizing stops and positions. As a trailing stop on its own it didn’t beat holding the S&P 500 at any of the 15 settings I tested, and on Bitcoin the result swung wildly from one setting to the next.
What is the average true range?
J. Welles Wilder introduced the ATR in his 1978 book New Concepts in Technical Trading Systems, the same book that gave us the RSI. It starts with the true range of each day, which is the largest of three numbers: today’s high minus today’s low, today’s high minus yesterday’s close, and yesterday’s close minus today’s low. The last two catch gaps that a plain high–low range misses.
A real example: on 21 October 2026 the S&P 500 closed at 7,757.17. The next day it opened lower and traded between 7,637.36 and 7,702.94. The high–low range was 65.58 points. But the index never got back to the previous close, so the true range is 7,757.17 − 7,637.36 = 119.81 points, almost twice as much.
The ATR is a 14-day average of those true ranges, using Wilder’s smoothing: take yesterday’s ATR times 13, add today’s true range and divide by 14. On 23 October the S&P 500 had a true range of 51.36 points, so its ATR went from 73.94 to (73.94 × 13 + 51.36) / 14 = 72.33 points. Most charting platforms use 14 days as the default.
How to read ATR: points vs percent
ATR is in price units, so 72 points on the S&P 500 and $6.41 on Apple can’t be compared directly. Divide by the price and you get a number you can compare across markets:
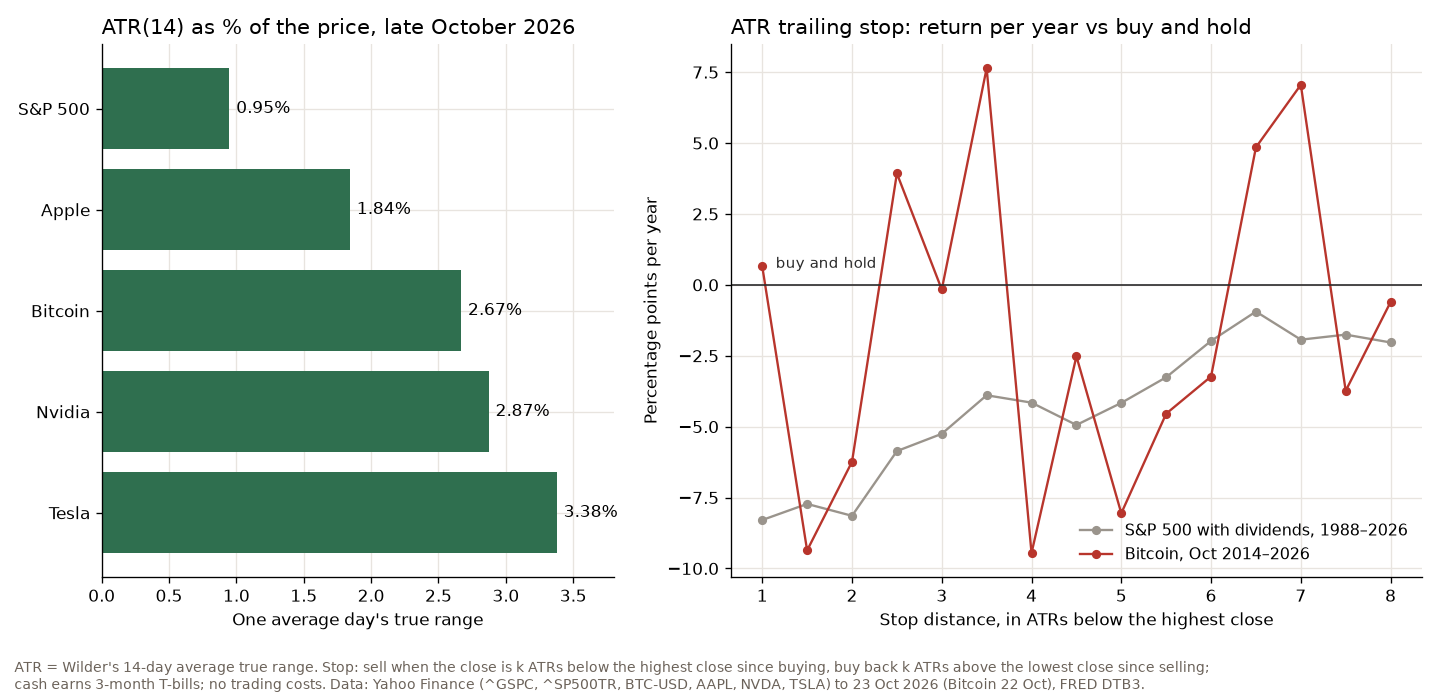
The S&P 500 moves about 0.95% on an average day, Nvidia 2.9% and Bitcoin 2.7%. That is why one stop percentage can’t fit every market. A 10% stop is about 11 average days of movement on the S&P 500 and fewer than 4 on Bitcoin. The same 10% is a wide stop on one and a fairly tight one on the other.
How to use ATR in trading
ATR doesn’t tell you direction. It tells you how much room the market normally needs, and traders use it in three ways.
Position size. In Stocks on the Move, Andreas Clenow sizes every stock by its ATR: 0.1% of the account divided by the 20-day ATR gives the number of shares, so a jumpy stock gets a smaller position (my Clenow review has the rules).
Stop distance. A stop closer than about one ATR sits inside normal daily noise. In my post on stop loss trading, a stop two ATRs under a SPY entry looked careful and would still have been taken out by one ordinary bad day.
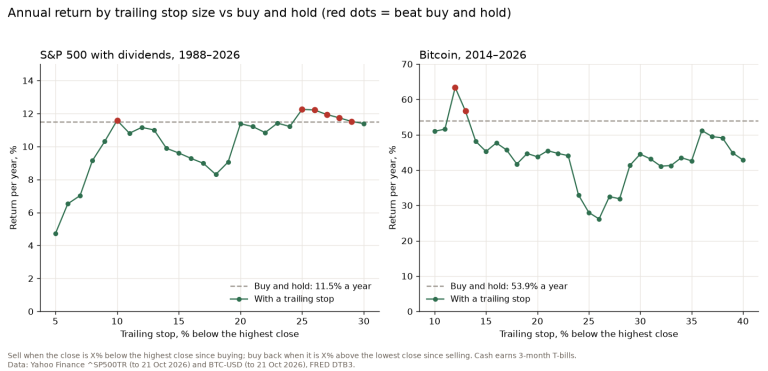
Trailing stops. The best-known version, often called a chandelier exit, trails the stop a few ATRs below the highest point of the move. In my test of fixed-percentage trailing stops, which stop size happened to work was mostly luck. An ATR stop adjusts to volatility by itself, so I tested whether that helps.
Does an ATR trailing stop work?
The rule: sell when the close is k ATRs below the highest close since buying, and buy back when it is k ATRs above the lowest close since selling. Cash earns the 3-month T-bill rate, there are no trading costs, and I tested every k from 1 to 8 in steps of 0.5.
On the S&P 500 with dividends, from 1988 to 23 October 2026, holding made 11.4% a year. None of the 15 ATR stops beat it. The median one made 7.3% a year. A 1-ATR stop sold 761 times and made 3.1% a year; a 3-ATR stop, a common choice, made 6.2% after 169 sells; the best, 6.5 ATRs, made 10.5%. The reason is simple: the index’s median ATR is 1.1% of the price, so even 8 ATRs is a stop of about 9%, and on a slow-moving index that is still tight. The stops did cut the worst drop at 14 of the 15 settings, from 55% to as little as 24%.
On Bitcoin, from October 2014 (when the first 14-day ATR exists) to 22 October 2026, holding made 55.9% a year with a worst drop of 83%. 5 of the 15 ATR stops beat it, and all 15 had a smaller worst drop. Over the same window the percentage stops beat holding at 2 of 31 settings, with a median of 46.5% a year against 53.4% for the ATR stops. So adjusting to volatility helped a little. But look at the chart: 3.5 ATRs beat holding by 7.6 points a year and 4 ATRs lagged by 9.5. A result that flips by 17 points when you move the stop by half an ATR is not something you can choose in advance.
Costs matter too. The tight stops trade a lot: the 1-ATR stop on Bitcoin sold 275 times. With a cost of 0.25% on every buy and every sell it drops from 56.6% to 39.7% a year, and the number of ATR settings that beat holding falls from 5 to 3.
How I use ATR
The chart sets my stop, under the last swing low or the level the trade depends on, and the position size follows from how far away that stop is. ATR is the check I run afterwards. If the chart’s stop is less than about one ATR away, it sits inside the market’s normal daily noise, and the noise will hit it. Then the stop belongs where the noise stops and the structure starts, with a smaller position to match.
What I don’t do is let an ATR multiple decide on its own when I’m out of a market I want to hold. The test above is why.
FAQ
What does ATR 14 mean?
The average true range over the last 14 bars, smoothed the way Wilder described. On a daily chart it is about three weeks of trading for a stock, two weeks for Bitcoin, which trades every day.
What is a good ATR?
There is no good or bad level. ATR describes how much a market moves, not whether it is a buy. Compare it as a percentage of the price: in late October 2026 that was 0.95% for the S&P 500 and about 3.4% for Tesla.
Is ATR good for day trading?
It is useful for setting a realistic target and stop. If the S&P 500’s daily ATR is 72 points, a day trade aiming for 100 points needs an unusually big day. For stops inside the day, use ATR on the intraday bars you trade, not the daily one.
ATR is a ruler. It measures the room a market needs, which makes it good for sizing stops and positions. As a signal on its own, it was no better than any other trailing stop.
Not financial advice. This is educational content, shared for information and entertainment only, and it is not a recommendation to buy or sell any asset. Backtests and past results do not guarantee future results, and the numbers or charts here may contain mistakes. Trading carries risk, including losing all the money you put in. Do your own research before you make any decision.