A trailing stop loss sells when the price falls a set percentage below its highest point since you bought. I tested every size from 5% to 30% on the S&P 500 since 1988 and from 10% to 40% on Bitcoin since 2014. Most of them cut the worst drawdown. Very few beat simply holding: 6 of 26 on the S&P 500 and 2 of 31 on Bitcoin. And which ones won was mostly luck.
What is a trailing stop loss?
A normal stop loss sits at a fixed price. A trailing stop follows the price up and never moves down. Say you buy a stock at $100 with a 25% trailing stop. The stop starts at $75. If the stock climbs to $140, the stop climbs to $105, 25% below the new high. If the stock then falls back to $105, you’re out with a 5% gain, even though you were up 40% at one point. That gap between the high and the exit is the price of the protection.
Brokers offer this as a trailing stop order that follows the price during the day. In this test I used daily closes instead: sell when the close is X% below the highest close since buying. The question every guide skips is what happens after you’re out, so I added the mirror rule: buy back when the close is X% above the lowest close since selling. While out of the market the money earns the 3-month T-bill rate. Where to put the first stop is in my post on stop loss trading; this one is only about the trailing kind.
Trailing stops on the S&P 500: the results
I used the S&P 500 total return index (dividends included) from January 1988 to 21 October 2026. Buy and hold made 11.5% a year, with a worst drop of 55% in 2007–09.
| Trailing stop |
Per year | Worst drop |
Sells |
|---|---|---|---|
| None (hold) | 11.5% | −55% | 0 |
| 5% stop | 4.7% | −55% | 128 |
| 10% stop | 11.6% | −33% | 27 |
| 15% stop | 9.6% | −47% | 16 |
| 20% stop | 11.4% | −48% | 6 |
| 25% stop | 12.3% | −30% | 3 |
| 30% stop | 11.4% | −34% | 3 |
A tight stop is a disaster. At 5% the rule sold 128 times, and 104 of those times it bought back at a higher price than it sold. It made 4.7% a year and still went through a 55% drawdown, because a slow slide gets you whipsawed all the way down.
The wider stops look better, and the 25% stop even beat buy and hold with about half the worst drop. Before you copy that, look at all 26 settings from 5% to 30% in the chart below.
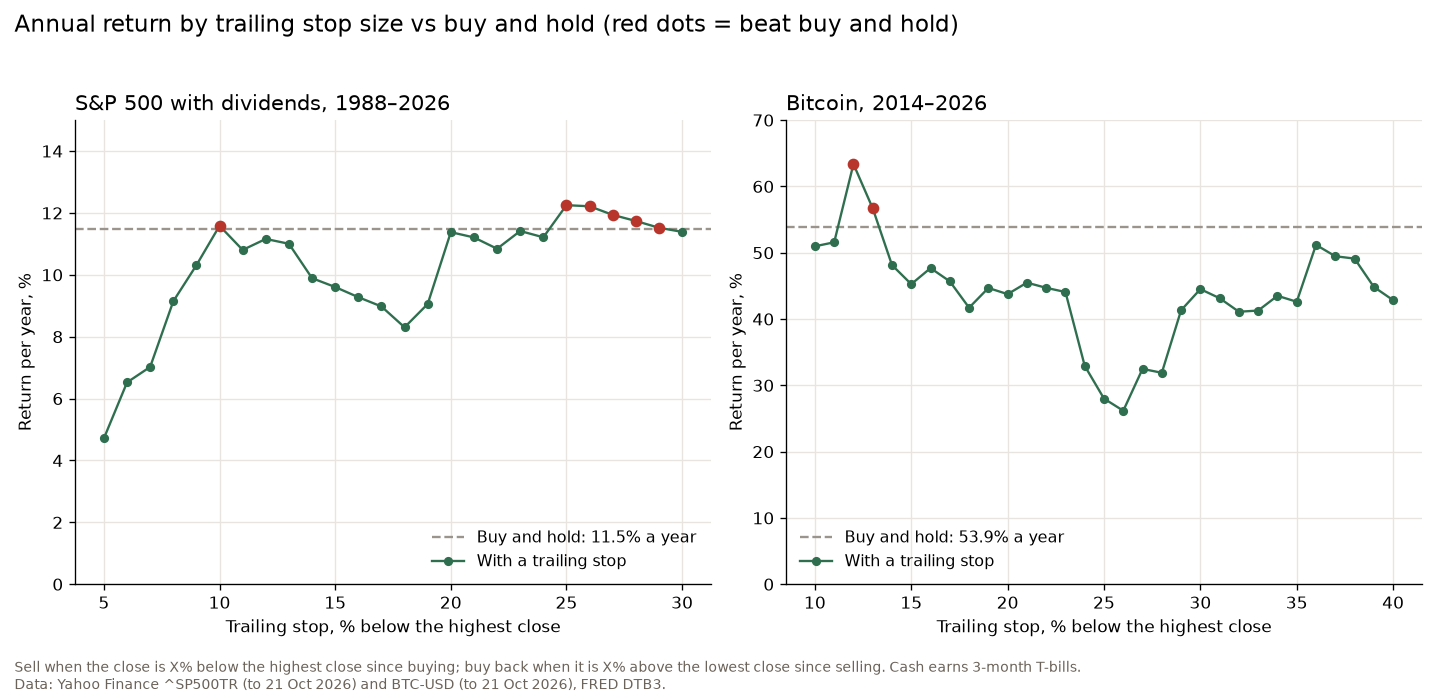
Only 6 of the 26 beat holding: 10%, and 25% to 29%. 11% made 10.8% a year, 18% made 8.3%, and 17%, 18% and 19% had a deeper worst drop than holding (58–64%). A rule whose result swings that much when you move it by one percentage point isn’t a rule you can pick in advance. The good settings are the ones whose exits happened to land before the right crashes. The 25% stop sold only three times in 38 years: March 2001, September 2008 and March 2020.
What the stops did do, at 21 of the 26 settings, is make the worst drop smaller. If that’s the goal, a trailing stop helps. If the goal is a higher return, the data doesn’t support it.
The same stop in 2008 and 2020
The 25% stop shows both sides. On 29 September 2008 it sold, and on 9 April 2009 it bought back 21% lower. That is the trade everyone who sells trailing stops shows you. On 12 March 2020 it sold again, and on 14 April it bought back 15% higher, because the market fell 34% in five weeks and then bounced hard: the rule bought back after a 27% rise from the low. The 10% stop got 2020 right (sold 27 February, bought back 17% lower on 25 March) but sold 27 times over the whole period, and 17 of those buy-backs were at a higher price.
No percentage gets every crash right. A stop wide enough to sit through normal pullbacks reacts late to a fast crash and buys back late after a fast recovery.
Trailing stops on Bitcoin
Bitcoin is where people expect a trailing stop to shine: huge trends, then 80% crashes. From September 2014 to 21 October 2026 buy and hold made 53.9% a year, with a worst drop of 83%.
Only 2 of the 31 settings from 10% to 40% beat that: 12% and 13%. The median was 44.5% a year, and the 25% stop made 28.0% with a worst drop of 80%, almost as deep as holding. A 20% stop made 43.8% a year with a worst drop of 58%, after 37 sells, 25 of them bought back higher. As on the S&P 500, most settings cut the drawdown (23 of 31), but they gave up a lot of return to do it.
This fits what I found in the Bitcoin death cross study: by the time a trend signal fires on Bitcoin, the fall has often already happened.
How I use a trailing stop
I do trail my stops, but not by a fixed percentage. In my review of William O’Neil’s book I disagreed with his rule to cut losses at a fixed percentage, because the same 8% means something different on a quiet stock and a wild one. The same goes for trailing: I move the stop under each new swing low as the trend makes higher lows, so the chart decides the distance. Nicolas Darvas’s box system worked on the same idea: buy when the price moves up out of its box, sell when it falls out of the bottom. When I held Bitcoin in 2020–21 I wrote that my trailing stop lagged behind a lot in the parabolic move, and that I accept giving back some open profit at the end of a trend in exchange for staying in it.
That’s the trade-off. A trailing stop controls how much of a run you give back. In this test it rarely made more money than holding. Size it to the instrument’s normal swings, expect it to sell you near a low now and then, and decide in advance what makes you buy back. Without a re-entry rule, a trailing stop is just a delayed sell order. The Setup Lab tests other exits the same way.
FAQ
What does a 25% trailing stop mean?
The stop sits 25% below the highest price since you bought, and it only moves up. If you buy at $100 and the price peaks at $160, the stop is at $120. If the price falls to $120, the position is sold.
What is the best trailing stop percentage?
There isn’t one. On the S&P 500 since 1988, 10% and 25–29% beat buy and hold while 11–24% did not, and on Bitcoin only 12% and 13% of 31 settings did. Too tight a stop sells on normal noise; what is normal depends on the market.
Are trailing stop losses a good idea?
For limiting drawdowns, often yes: most settings I tested cut the worst drop. For beating buy and hold, rarely. They also need a rule for getting back in, or the first false alarm leaves you out of the market.
What is the 7% stop loss rule?
It’s William O’Neil’s rule from How to Make Money in Stocks: sell any stock that falls 7–8% below what you paid. That is a fixed stop from the entry price, not a trailing stop. More on it in stop loss trading.
A trailing stop won’t make you rich and it won’t save you from every crash. It decides how much of a good run you’re willing to hand back. Pick that number for your nerves, not from a backtest.
Not financial advice. This is educational content, shared for information and entertainment only, and it is not a recommendation to buy or sell any asset. Backtests and past results do not guarantee future results, and the numbers or charts here may contain mistakes. Trading carries risk, including losing all the money you put in. Do your own research before you make any decision.