To read a stock chart, start with the time frame, then look at each bar’s open, high, low and close, then at the trend, the support and resistance levels, and the volume. In that order, a chart tells you where the price has been, which side has been in control, and where you would be proven wrong. It does not tell you where the price will go next. Here is how I read one, step by step, on a real Apple chart.
What a stock chart shows
Time runs left to right along the bottom, price runs up the right side, and each bar or candle is one period of trading: a day on a daily chart, a week on a weekly one. The bars along the bottom are volume, the number of shares that changed hands in that period. That is the whole chart. Everything else people draw on it, moving averages and lines and indicators, is calculated from those few numbers. For the full catalogue of what traders draw on top, John Murphy’s book is still where I’d start: my review of Technical Analysis of the Financial Markets. Martin Pring’s Technical Analysis Explained covers the same classical ground just as well.
The first thing I check is the time frame, because the same stock can be in an uptrend on a weekly chart and a downtrend on a 5-minute one. Both are true. Pick the one that matches how long you plan to hold. I mostly use daily bars, with a weekly chart for the bigger picture.
How to read a price bar or candlestick
Every bar carries four prices: the open, the high, the low and the close. On a bar chart the vertical line runs from the low to the high, a small tick to the left marks the open and a tick to the right marks the close. A candlestick shows the same four prices with a box (the body) between the open and the close and thin lines (the wicks or shadows) out to the high and low. Green or white usually means the close was above the open, red or black that it was below.
The close is the price I care about most. Intraday spikes come and go, but the close is where buyers and sellers agreed to leave it at the end of the day, and most of my rules are written on closes. A long wick tells you price went somewhere and got pushed back. That can matter, as you’ll see below.
How I read a chart, step by step
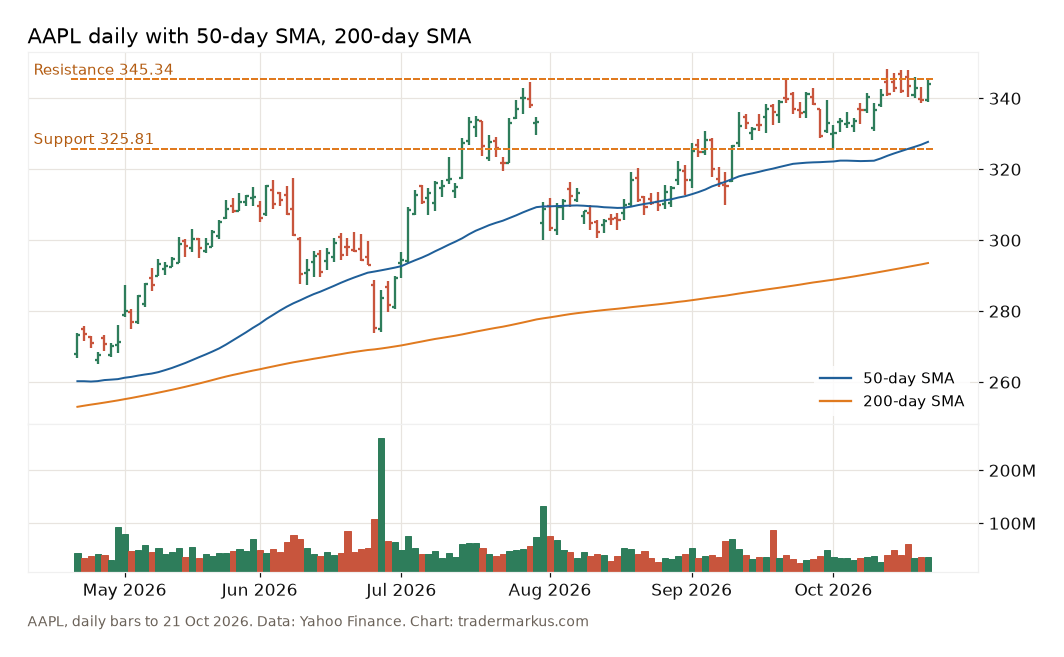
Here is Apple’s daily chart for the six months to 21 October 2026, with the 50-day and 200-day moving averages and two levels I marked.
1. The trend
An uptrend is a series of higher highs and higher lows. Since the end of July Apple’s swing lows have stepped up: 300.00 on 31 July, 309.90 on 9 September, 325.81 on 1 October. The big highs went up too, but only just: 344.57 on 29 July, 345.34 on 22 September, 348.15 on 13 October. Rising lows under flat highs is a trend that is still working but pressing against a ceiling. I don’t need an indicator to see that. Stan Weinstein built a whole method on reading this: in his stage analysis, you buy as a stock breaks out of a base into an uptrend and sell as it breaks down from a top.
2. The moving averages
The averages confirm what the bars already say. Apple closed at 343.99 on 21 October, above its 50-day average (327.70) and its 200-day average (293.55), and the 50-day is above the 200-day. I use the 200-day as a simple dividing line between markets I want to be long and markets I leave alone; on the S&P 500 I tested how much it actually tells you in this post on the 200-day moving average.
3. Support and resistance
Resistance is a price where rallies have stopped before. Apple topped at 344.57 on 29 July and at 345.34 on 22 September, so the area around 345 is resistance. From 13 to 19 October it traded above that on five days in a row, as high as 348.15, and closed below 345 every time. That is what the upper wicks are telling you: buyers got above the old highs and couldn’t hold it by the close. Support is the opposite, a price where selling stopped, and the nearest one is the 1 October low at 325.81. I wrote more about how to pick these levels in my NVDA support and resistance post.
4. Volume
Volume shows how much conviction was behind a move. On 16 October, one of those days above the old high, 59.9 million Apple shares traded, against an average of 40.1 million over the previous 50 days. Heavy volume at a resistance level means it is being fought over. I’d want to see a close above 345 on volume like that before calling it a breakout.
5. Where I’d be wrong
This is the step most guides leave out, and it is the only one that protects your money. A chart can’t tell you what happens next, but it can tell you where your idea stops making sense. If I bought on a close above 345.34, the idea would be wrong below 325.81, the last higher low. That is a stop about $19.53 away, close to 6% of the price. With a $10,000 account and 1% risk per trade, that is $100 of risk and 5 shares. The chart sets the stop; the stop sets the size. The arithmetic is in stop loss trading.
How to predict if a stock will go up or down
You can’t, not reliably, and anyone selling a chart method that predicts is selling the wrong thing. What a chart gives you is odds and a place to stand. Even the 200-day average, the most watched line there is, didn’t pick better years on the S&P 500: the year after a close above it returned about the same as the year after a close below it, just with smaller swings. Of the eight chart signals I’ve tested in the Setup Lab, six made less per year than simply holding the market. Reading the chart well mostly means knowing where you’re wrong before you get in.
FAQ
What is the best chart type for beginners?
A daily bar or candlestick chart, with volume underneath. A line chart of closing prices is fine for the long-term picture, but it hides the highs and lows you need for stops.
What do the green and red colors mean?
On most platforms green means the bar closed above its open and red means it closed below. Some charts color the bar against the previous close instead, so check your platform’s setting before reading too much into a color.
What time frame should I use?
The one that matches your holding period. If you hold for weeks, use daily bars and look at the weekly chart for the bigger trend. Short time frames show more noise and more signals, and more signals usually means more costs.
A chart is a record of what people did with their money. Read it for where you’d be wrong, not for where the price is going.
Not financial advice. This is educational content, shared for information and entertainment only, and it is not a recommendation to buy or sell any asset. Backtests and past results do not guarantee future results, and the numbers or charts here may contain mistakes. Trading carries risk, including losing all the money you put in. Do your own research before you make any decision.