An inside bar is a bar whose high is lower and whose low is higher than the bar before it, so the whole day fits inside the previous one. Traders read it as a pause and trade the breakout of the bigger “mother” bar. I tested that on daily S&P 500 data since 2014: the breakout reached a 1:1 target 51% of the time, close to break-even before costs. Breaking any ordinary day’s range did better.
What is an inside bar?
Two bars make the pattern. The first one, the mother bar, sets a range. The second one, the inside bar, trades entirely within it: a lower high and a higher low. On a daily chart it means the market spent a whole session not going anywhere new. The usual reading is that the market is coiling, and that the break out of the mother bar’s range tells you which side won.
It is not the same thing as a harami, although the two get mixed up. StockCharts’ candlestick pattern dictionary defines the harami by the candle bodies: a small body contained within the previous body, in the opposite color. The inside bar uses the full range, highs and lows, and the color doesn’t matter.
How to trade an inside bar breakout
The textbook version is mechanical, which is why I could test it. Put a buy stop just above the mother bar’s high and a sell stop just below its low. Whichever one fills is the trade, and the other end of the mother bar is the stop. A common target is the size of the mother bar again, which makes it a 1:1 trade.
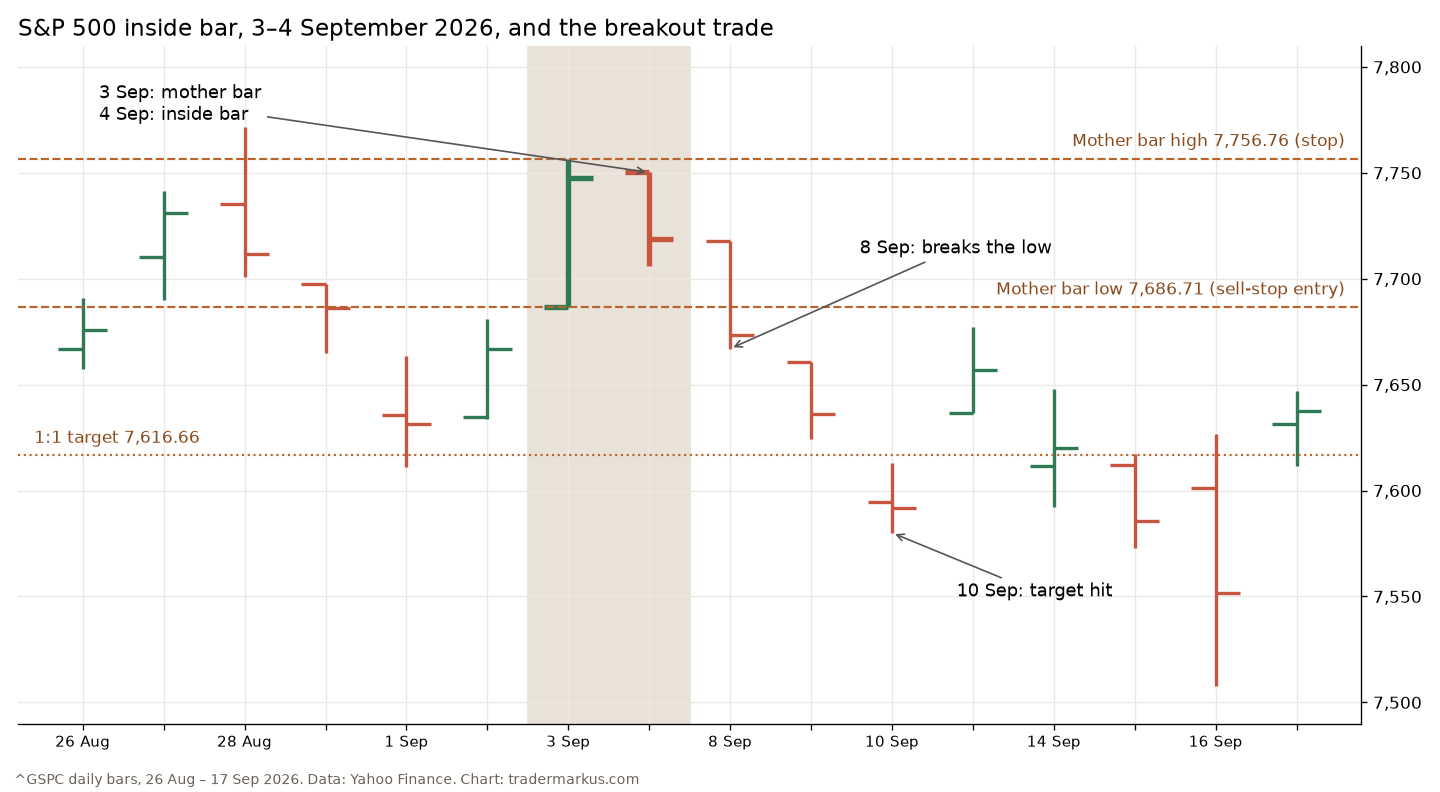
Here is a real one. On 3 September 2026 the S&P 500 traded between 7,686.71 and 7,756.76. On 4 September it stayed inside that range. On 8 September it broke the low, which would have opened a short at 7,686.71 with the stop at 7,756.76, 70 points away. The 1:1 target was 7,616.66, and the index traded below it on 10 September.
That one worked. The question is how often it works, so I counted all of them.
Does the inside bar breakout work? A test on the S&P 500
I used Yahoo Finance’s daily bars for the S&P 500 index from 2 January 2014 to 20 October 2026, 3,219 days. I start in 2014 because the earlier free data is unreliable for this: the opening price is often just the previous day’s close, and before about 2006 the highs and lows almost always stretch back to that close, which changes exactly the ranges an inside bar is made of. The rules were the ones above: entry at the mother bar’s high or low (or at the open if the market gapped through it), stop at the other end, target at one mother-bar range, up to 20 days in the trade. Daily bars don’t show which came first within a day, so when one day touched both the stop and the target, I counted it as a loss. When a day broke both sides of the mother bar at once, I also counted it as a loss, because a trader with both orders working gets filled on one side and stopped on the other. The newest inside bar, on 19 October, hadn’t broken either side by the 20 October close, so it isn’t in the count.
| Inside bar |
Any day |
|
|---|---|---|
| Setups | 351 | 3,217 |
| Broke both sides in a day |
4.3% | 10.2% |
| Reached the 1:1 target |
50.7% | 54.5% |
| Average result (R) |
+0.03 | +0.07 |
“Any day” is the control: the same trade on the break of every day’s range, inside bar or not. R is the risk per trade, the size of the mother bar. So the inside bar breakout made almost nothing on paper, 0.03 of the risk per trade. A typical mother bar was about 1.1% of the price, so that is roughly 0.03% of the index per trade, before commissions and slippage take their share. Breaking an ordinary day’s range made more than twice as much. The inside bar’s one real advantage is that it broke both ways on the same day less than half as often, which is the most annoying way to lose on this setup.
Which way do inside bars break?
Up, more often: 202 broke up and 134 broke down, 60% up against 54% of all days that closed higher, which is what you’d expect in a market that rose most of those years. Once a side broke, both directions did about the same. Long breakouts hit the target 52% of the time and short ones 54.5%, not counting the 15 days that broke both sides. With about 27 inside bars a year, slicing them further (by trend, by gap) leaves samples too small to trust.
How I use inside bars
An inside bar is a quiet day, and a quiet day gives you a tight range to put a stop behind. That is the useful part. It is a good place to define risk when I already have a reason to be in the market, not a reason by itself. The test says the pattern on its own is close to a coin flip with a slight tilt, about what you get from breaking any bar. If you want to trade it anyway, size it from the distance to the stop like any other setup: see stop loss trading for the sum, and risk reward ratio for why 51% at 1:1 is not enough once costs come in.
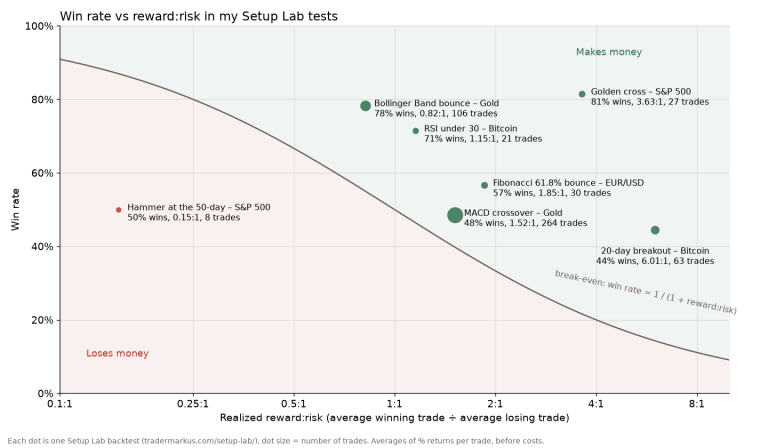
This is the same lesson I got from the hammer test in the Setup Lab: a candlestick pattern on a daily S&P 500 chart carries much less information than the books suggest.
FAQ
What is a mother bar?
The bar before the inside bar, the one whose range contains it. Its high and low are the breakout levels, and its size usually sets the stop distance and the target.
Is an inside bar bullish or bearish?
Neither by itself. In my S&P 500 data since 2014, 60% of inside bars broke upward, a bit more than the 54% of all days that closed up. The direction comes from the breakout, and once it broke, both directions reached a 1:1 target 52–55% of the time.
Does the inside bar work on other timeframes?
I only tested daily bars on the S&P 500 index, so I can’t say. Intraday inside bars are far more frequent and costs eat a bigger share of each trade. Test it on your own market and timeframe before trusting it.
An inside bar tells you where the risk is. It doesn’t tell you where the market is going.
Not financial advice. This is educational content, shared for information and entertainment only, and it is not a recommendation to buy or sell any asset. Backtests and past results do not guarantee future results, and the numbers or charts here may contain mistakes. Trading carries risk, including losing all the money you put in. Do your own research before you make any decision.