A doji candle is a day that closes almost exactly where it opened. Textbooks call it indecision and say that after a rally it can warn of a turn. I tested that on the S&P 500 since 2014 and on Bitcoin since 2015. On the S&P 500 a doji was an ordinary day: the next five days averaged +0.27%, against +0.25% after any day. On Bitcoin, a doji in an uptrend came before a flat week, +0.05% against the usual +1.43%, but most of that gap comes from the 2015–2020 bull years.
Candlestick names promise a lot. A doji sounds like the market holding its breath. So here is what actually came next, with my rules written down, so you can check them.
What is a doji candle?
A candle has a body, from the open to the close, and wicks, up to the high and down to the low. In a doji the body is so thin it almost disappears. StockCharts’ candlestick dictionary puts it simply: a doji forms when the open and close are virtually equal, and it conveys indecision between buyers and sellers.
“Virtually equal” is not a rule you can test, so I picked one: the body is at most 10% of the day’s high-to-low range. A day that trades 100 points and closes within 10 points of its open is a doji. By that rule about one day in ten is a doji, on both markets.
The names you will see are just doji with the wicks in different places:
- Long-legged doji: long wicks on both sides, the body in the middle.
- Dragonfly doji: open and close at the high of the day, a long lower wick.
- Gravestone doji: open and close at the low, a long upper wick.
I tested the plain doji only. Splitting 311 days into three shapes would leave too few of each to say anything.
How I tested it
Daily candles from Yahoo Finance: the S&P 500 index from January 2014 (before that, Yahoo’s opening prices for the index are often just the previous close, which makes every candle body wrong) and Bitcoin from January 2015, both to early November 2026. For every doji I measured the return over the next 1, 5 and 20 trading days, close to close. The comparison is every day in the same sample, because both markets went up a lot and almost any day was followed by a gain.
The common claim is about context, a doji after a rally, so I also split the days by trend: uptrend means the close was above its 20-day average, downtrend means below. A doji in an uptrend is compared with every uptrend day, not with all days.
What came after a doji
Average return over the next 5 trading days, and the share of those weeks that ended higher:
| After… | S&P 500 | Bitcoin |
|---|---|---|
| All days | +0.25% (60.2%) | +0.96% (54.7%) |
| Doji | +0.27% (61.4%) | +0.05% (51.4%) |
| Uptrend, all | +0.17% (60.1%) | +1.43% (54.9%) |
| Uptrend, doji | +0.19% (63.5%) | +0.05% (49.3%) |
| Downtrend, all | +0.40% (60.5%) | +0.38% (54.4%) |
| Downtrend, doji | +0.49% (55.6%) | +0.04% (53.6%) |
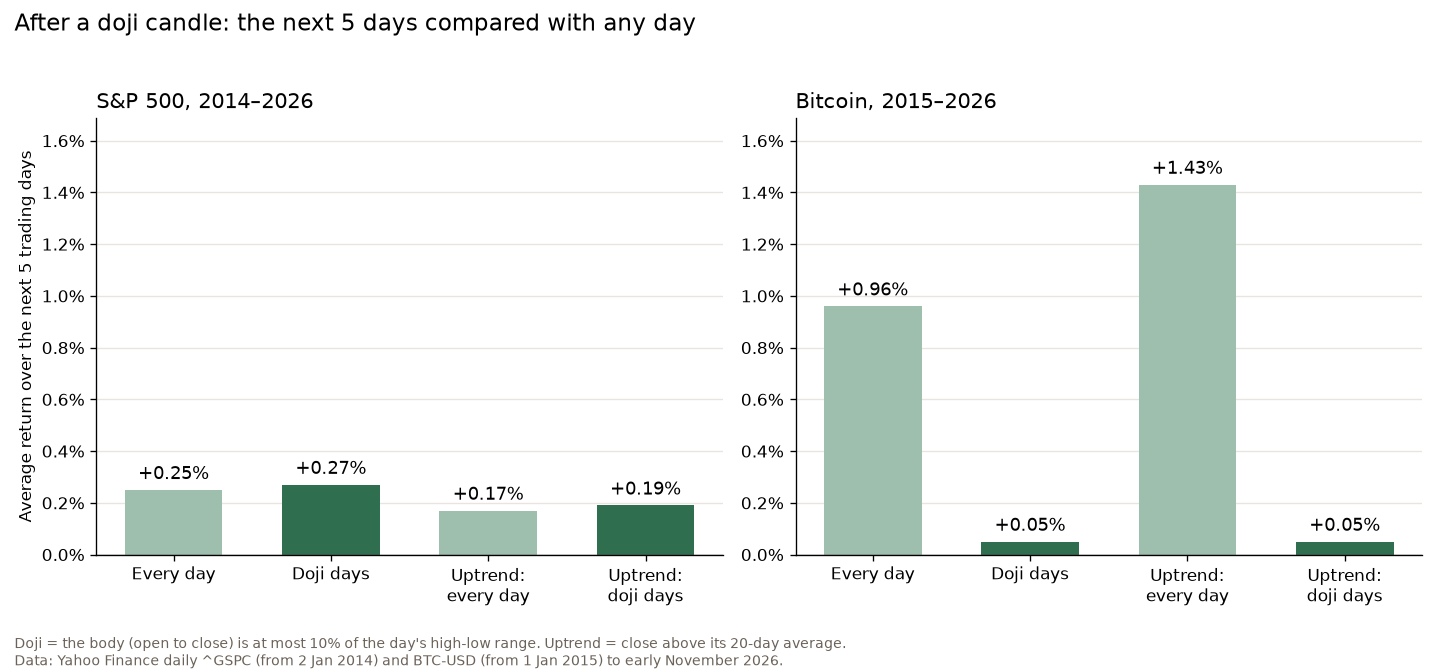
S&P 500: nothing. 311 doji in almost 13 years, and the week after them looks like every other week. The “warning after a rally” did not show up either: after a doji in an uptrend the index rose in 63.5% of the following weeks, slightly more often than after any uptrend day. If anything that is the wrong way round for a reversal signal, and the gap is small enough to be luck. When I drew 10,000 random sets of 230 uptrend days, 57% of them did worse than the doji days. That is what no effect looks like.
Bitcoin: a pause, not a turn. Here the doji did mean something, at least on average. In an uptrend the next week averaged +0.05%, against +1.43% for any uptrend day, and only 49.3% of those weeks ended higher. Only 0.3% of 10,000 random sets of uptrend days did as badly, so this is not easy to wave away. But two things keep me from calling it a sell signal. First, the average week after an uptrend doji was flat, not down. A pause in a rally is not a reversal. Second, the effect is mostly old. From 2015 to late 2020 the week after an uptrend doji averaged +0.23% against +2.16%, and ended higher only 45.5% of the time against 58.9%. From late 2020 on it was −0.13% against +0.62%, and the doji weeks actually ended higher more often, 53.3% against 50.4%.
I also checked the rule. With a stricter doji (body at most 5% of the range) or a looser one (15%), the S&P 500 result stayed at nothing and the Bitcoin uptrend result stayed flat, between −0.73% and +0.05% for the week.
Does a doji come before a big move?
The other story is that indecision ends with a breakout, so a doji should come before a bigger day. It doesn’t. The typical move on the day after a doji was 0.47% on the S&P 500, against 0.48% after any day. On Bitcoin it was 1.46% against 1.40%. A doji is a quiet day: its median high-to-low range was 0.67% on the S&P 500 against 0.87% for all days. Quiet days are followed by ordinary days.
How I would use a doji
I read candles every day, and a doji at a level I already care about does make me look twice. But I wrote back in 2024 that you can’t look at short-term candlestick patterns and expect them to show investors’ behaviour, and this test agrees. On its own, a doji is one more day.
So the order matters. The level comes first: support, resistance, a moving average, a trend line. The candle comes second, as a reason to watch the next day more closely, not as the entry. If the next day breaks the doji’s high or low, that is the signal, and the doji’s other end gives a natural stop. Size the trade from that stop, the same way I do for the inside bar, which is another quiet candle that turned out to be less useful than its reputation. And if you trade Bitcoin, a doji in a strong uptrend is a fair reason not to add to the position that day. It is not a reason to short.
I have tested other single candles too, all with the same result so far. The hammer at the 50-day average and the bullish engulfing candle both lost money on the S&P 500 in the Setup Lab.
FAQ
Is a doji candle bullish or bearish?
Neither by itself. On the S&P 500 since 2014 the week after a doji was as positive as any other week. On Bitcoin a doji in an uptrend came before a flat week on average, which is weaker than normal but not bearish.
What happens after a doji?
Usually an ordinary day. The next day’s move was no bigger than after any other day: 0.47% against 0.48% on the S&P 500, 1.46% against 1.40% on Bitcoin.
How do you trade a doji?
Not on its own. Use it only at a level you already marked, wait for the next day to break the doji’s high or low, put the stop beyond the other end, and size the position from that stop.
How common is a doji?
With a body of at most 10% of the day’s range, about one day in ten: 311 of 3,213 days on the S&P 500 and 428 of 4,310 days on Bitcoin.
A doji tells you that one day ended where it started. That is worth noticing, but the textbooks give it far more weight than the data does.
Not financial advice. This is educational content, shared for information and entertainment only, and it is not a recommendation to buy or sell any asset. Backtests and past results do not guarantee future results, and the numbers or charts here may contain mistakes. Trading carries risk, including losing all the money you put in. Do your own research before you make any decision.