The head and shoulders is the best-known reversal pattern in technical analysis: three peaks, the middle one highest, and a break of the neckline is supposed to start a decline. I wrote the pattern down as fixed rules and found 35 of them on the S&P 500 since 1970. Sixty trading days after the break the index was higher in 22 of them, with a median gain of +2.55%, against +2.65% for any day. Gold went up after its head and shoulders tops more often than not, and Bitcoin’s result depends on how you draw the pattern.
Every chart book has a head and shoulders on a page with a neat arrow pointing down. Those examples were picked after the fact. So here is what happens when a computer finds them for you, using the same rules every time, including the ones that didn’t work.
What is a head and shoulders pattern?
A head and shoulders top has three peaks. The left shoulder, then a higher peak (the head), then a lower peak again (the right shoulder). The lows between the peaks are joined into a line, the neckline. StockCharts’ ChartSchool describes it as a reversal pattern that forms after an uptrend, and gives the usual price target: after the break, measure the distance from the neckline to the top of the head and project it down from the neckline.
The inverse head and shoulders is the same shape upside down, at a bottom, and is read as bullish. This post tests the top.
How I tested it
A pattern you “see” can’t be tested, so these are my rules, on daily closing prices:
- Peaks: a peak is the highest close of the 11 days around it, so it is only known 5 days later.
- Head: at least 3% above both shoulders, and the highest close of the whole pattern.
- Shoulders: within 5% of each other, each 5 to 80 trading days from the head.
- Neckline: the line through the lowest close between the left shoulder and the head, and the lowest close between the head and the right shoulder. The head must stand at least 5% above it.
- Break: the first close below the neckline once the right shoulder is known, within 40 trading days, with no close above the head in between.
I measured the return 20 and 60 trading days after the break, whether the textbook target was hit within 60 days, and whether the price closed back above the neckline within 5 days. The comparison is any day in the same market, because markets that go up over time make almost any day look bullish later. Data: the S&P 500 from 1970, gold futures from 2000 and Bitcoin from 2014, all to 10 November 2026.
What happened after the break
Sixty trading days after the break, median return and how many ended higher:
| After the break |
Any day | |
|---|---|---|
| S&P 500 | +2.55% (22/35) | +2.65% (67%) |
| Gold | +4.54% (17/21) | +2.45% (63%) |
| Bitcoin | −1.79% (6/14) | +6.43% (58%) |
And how the breaks played out:
| Target hit in 60 days |
Back above in 5 days |
|
|---|---|---|
| S&P 500 | 12/35 | 19/35 |
| Gold | 3/21 | 13/21 |
| Bitcoin | 8/14 | 9/14 |
S&P 500: the “top” was an ordinary day. Twenty days after the break the median was +0.89%, against +1.07% for any day, and after 60 days +2.55% against +2.65%. The target was reached 12 times out of 35. More often, 19 times, the index closed back above the neckline within a week, which is the kind of break that traps short sellers. ChartSchool says the pattern forms after an uptrend, so I checked that too: 25 of the 35 heads were above their 200-day average. Those did a little worse, +0.73% after 60 days with 15 of 25 higher, but that is still a gain, not the decline the pattern promises.
Gold: if anything the opposite of the textbook. 17 of the 21 tops were followed by a higher price 60 days later, and the target was reached only 3 times.
Bitcoin: on closing prices, the 14 tops look bearish: a median of −1.79% after 60 days against +6.43% for any day, and the target was reached 8 times. But when I redrew the pattern on daily highs and lows instead of closes, Bitcoin had 12 tops with a median of +2.30%, and 8 of 12 were higher. A result that flips when you move the pencil is not one I would trade.
The same check kept the other two markets where they were: on highs and lows the S&P 500 had 28 tops (+3.40%, 17 of 28 higher) and gold 22 (+7.34%). I also wrote the whole test a second time from scratch, and it found exactly the same breaks.
A live one. While I was writing this, Bitcoin drew one by the same rules: left shoulder on 3 September 2026 at $81,272, head on 21 September at $86,603, right shoulder on 21 October at $84,012. It closed below the neckline on 26 October at $80,007, which makes it the 15th Bitcoin top in this test, too new to count in the tables. The textbook target is about $73,100. By 10 November it had not closed back above the neckline, and at $73,698 it had not reached the target. The 60-day mark is 25 December. The 14 earlier ones gave a different answer depending on how I drew them, so I’m not reading much into this one.
One that worked and one that didn’t
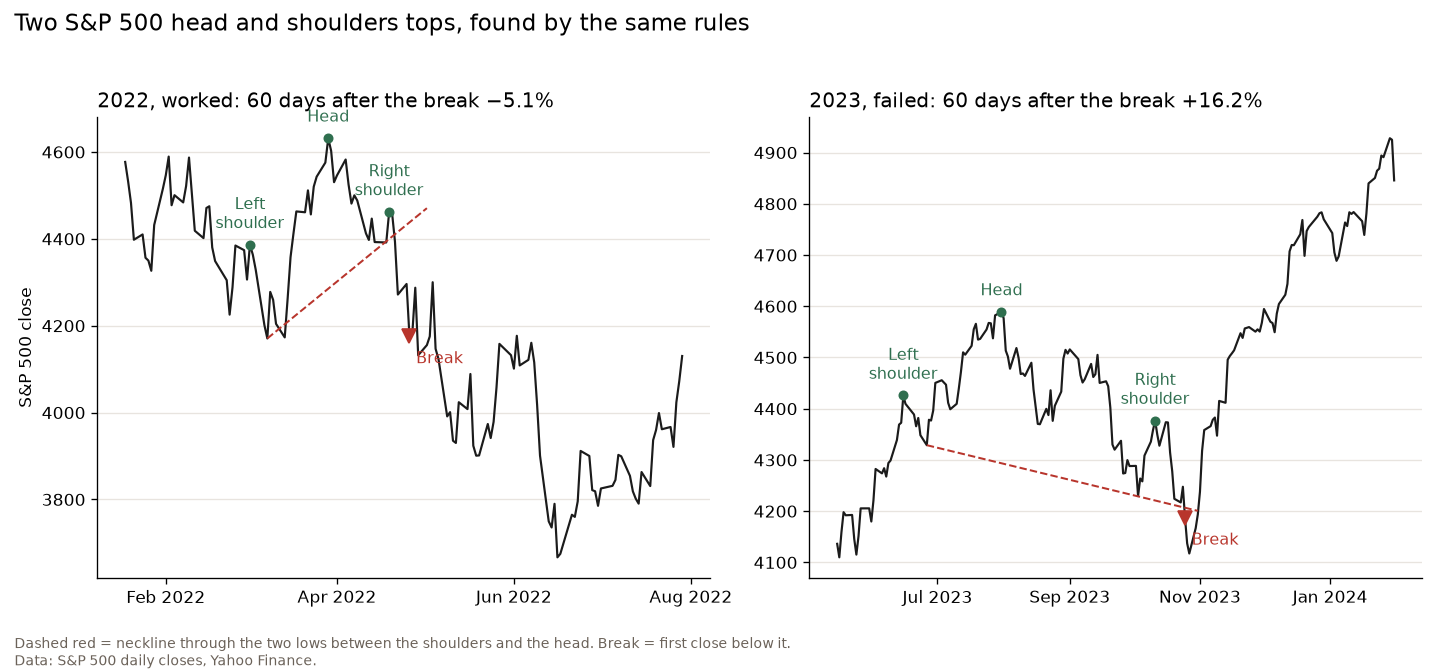
2022, worked. Left shoulder on 2 March, head on 29 March, right shoulder on 19 April. The index closed below the neckline on 26 April, reached the target and was 5.1% lower 60 trading days later. Look at the neckline, though: it slopes up steeply, so the “break” came well below the right shoulder. By the time the pattern was confirmed, a good part of the move was gone.
2023, failed. Left shoulder on 15 June, head on 31 July, right shoulder on 11 October, a break on 25 October. Within five days the index was back above the neckline, and 60 trading days later it was 16.2% higher. On a chart in a book this one would never appear.
How I would use a head and shoulders
The shape is easy to see and the test says it predicts little on its own. That is no reason to ignore it, but it changes what the pattern is for. When I reviewed Peter Brandt’s diary, I noted his seven head and shoulders trades in gold in 2009: five were winners, and the overall profit came thanks to one bigger win. He used the pattern to place a trade with a clear exit, not as a forecast, and I liked his point that technical analysis is a tool to manage trades, not a prediction of the future.
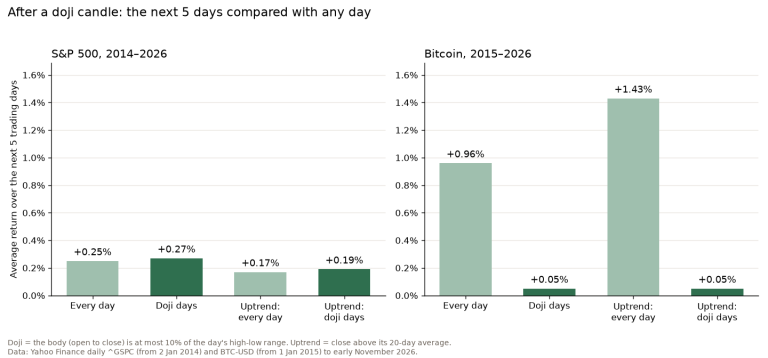
So if I trade a break, the stop goes back above the right shoulder, the position size comes from that distance, and I expect a lot of the breaks to fail. The test says about half of them came straight back above the neckline. The double top told the same story on the same data: a famous reversal pattern, and on the S&P 500 the days after it looked like any other days. So did the week after a doji candle.
FAQ
Is a head and shoulders pattern bullish or bearish?
A head and shoulders top is read as bearish and the inverse pattern as bullish. In my test the top was not reliably bearish: on the S&P 500 since 1970 the index was higher 60 days after the break in 22 of 35 cases.
What happens after a head and shoulders pattern?
Often not much. On the S&P 500 the median 60-day return after the break was +2.55%, close to the +2.65% of any day, and 19 of 35 breaks closed back above the neckline within five days.
How reliable is the head and shoulders price target?
The target, the height of the head projected down from the neckline, was reached within 60 trading days in 12 of 35 cases on the S&P 500, 3 of 21 on gold and 8 of 14 on Bitcoin.
How do you trade a head and shoulders?
Wait for a close below the neckline, put the stop above the right shoulder, size the position from that stop, and be ready to get out if the price closes back above the neckline. That happened in more than half of the cases I tested.
A head and shoulders is a good way to describe what a chart already did. As a forecast of what it will do next, it was no better than any other day.
Not financial advice. This is educational content, shared for information and entertainment only, and it is not a recommendation to buy or sell any asset. Backtests and past results do not guarantee future results, and the numbers or charts here may contain mistakes. Trading carries risk, including losing all the money you put in. Do your own research before you make any decision.