A double top is two peaks at about the same price with a dip between them. It counts as confirmed when price closes below the low of that dip, the neckline. I tested every confirmed double top on the S&P 500 since 1970 with fixed rules and found 22. Sixty sessions after the break the index was higher in 50% of cases, against 67% for any day. That is weaker than normal, not the crash the pattern promises, and in 13 of the 22 the price was back above the neckline within a week.
What is a double top pattern?
It is one of the oldest chart patterns, and it belongs to the classical charting that books like Martin Pring’s Technical Analysis Explained teach. Price rallies to a high, pulls back, rallies again to about the same level and fails. The low between the two peaks is the neckline. While price stays above it, the pattern is only a possibility. A close below it completes the double top, and the usual reading is that an uptrend has turned down.
StockCharts’ ChartSchool gives the textbook details: the first peak should be the high of the current trend, the second within about 3% of it, the peaks usually one to three months apart, and the dip between them at least 10%. The price target is the height of the pattern subtracted from the neckline. If the peaks are at 110 and the neckline at 100, the target is 90.
How I tested it
A pattern you can only see afterwards can’t be tested, so I wrote the rules down first and used daily closes only:
- Peak 1 is the highest close of the 21 days around it.
- Peak 2 is the highest close since peak 1, 10 to 60 sessions later and within 3% of peak 1.
- The neckline is the lowest close between the peaks, at least 5% below the lower peak.
- The signal is the first close below the neckline, no more than 60 sessions after peak 2.
Everything the rules use is known on the day of the break, so there is no hindsight in the signal date. I ran them on the S&P 500 from 1970, gold futures from 2000 and Bitcoin from 2014, all to 26 October 2026, and compared what happened next with the return from any day in the same market. A separately written second program found exactly the same signals.
What happened after a double top on the S&P 500
| Market | Tops | 60 days | Any day |
|---|---|---|---|
| S&P 500 | 22 | +0.5% 50% up |
+2.7% 67% up |
| Gold | 12 | +4.5% 83% up |
+2.5% 63% up |
| Bitcoin | 11 | −0.2% 45% up |
+6.6% 58% up |
Median return 60 sessions after the first close below the neckline, and how often the market was higher (for Bitcoin, which trades every day, 60 days). “Any day” is the same measure from every day in the data.
On the S&P 500 the signal tilted the odds down, but only a little. The measured-move target was reached within 60 sessions 9 times out of 22. In 13 of the 22 the index closed back above the neckline within five sessions, which is exactly the moment a short seller places a stop. Seven got back above the higher of the two peaks within 60 sessions.
Then I split the 22 by one of ChartSchool’s rules, that the first peak should be the high of the trend. Only five signals had a first peak at a six-month high: 1981, 1986, 1990, 1991 and 1997. All five were higher 60 sessions later, by a median of 8.9%, and none reached its target. The other 17 formed after the market had already come off an earlier high. Sixty sessions later only 35% of those were higher, against 58% for any day the index was below its 200-day moving average. So the textbook double top at a market high was a bad short on the index. The ones that worked were lower highs in a market that was already falling. And with a 10% dip between the peaks, as the textbook asks, and my other rules unchanged, the pattern never completed on the S&P 500 in 56 years.
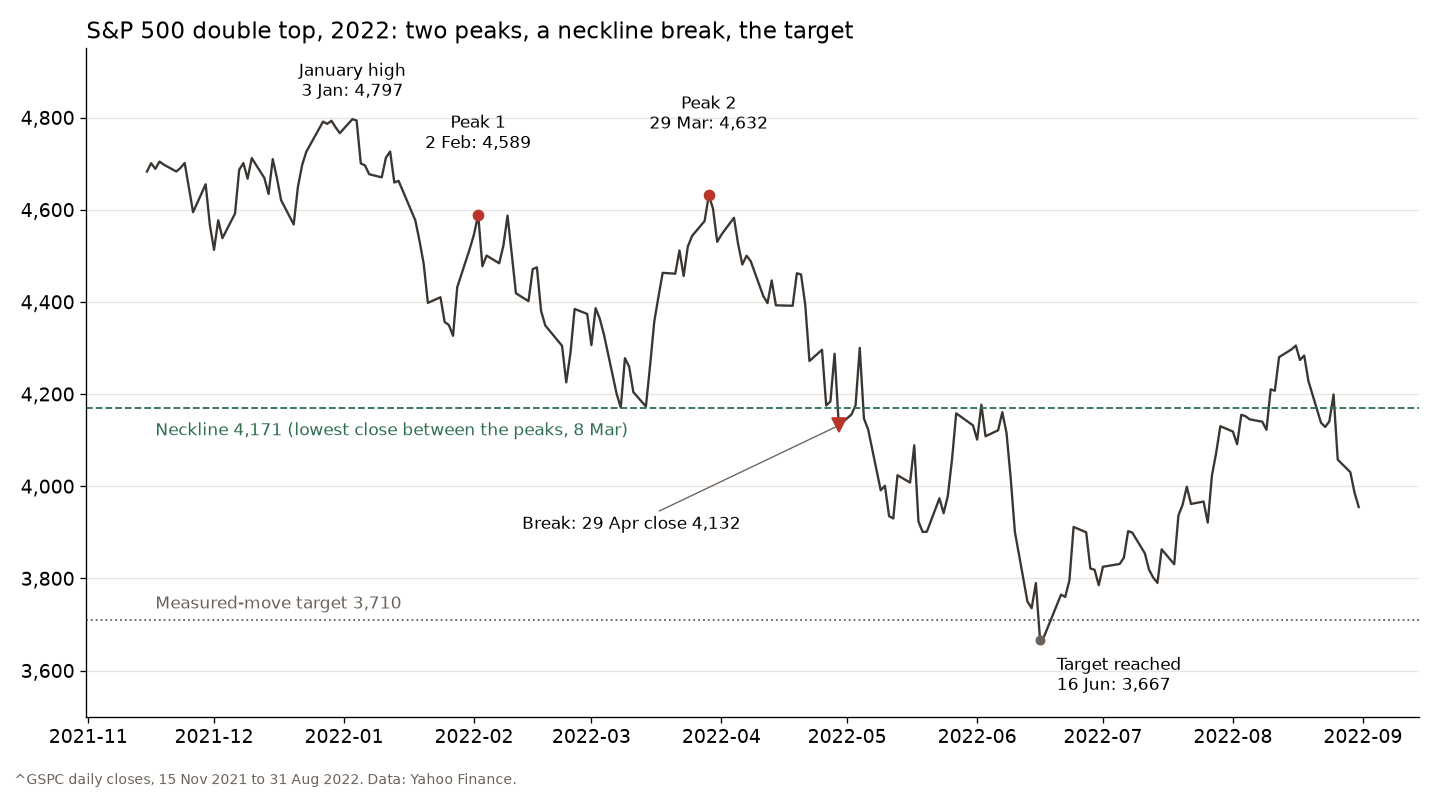
2022 is the clean example. The S&P 500 made its high on 3 January at 4,797. Peak 1 came on 2 February at 4,589, peak 2 on 29 March at 4,632, and the lowest close between them was 4,171 on 8 March. The index closed below it on 29 April at 4,132. The target, 4,171 minus the 461-point height, was 3,710, and the close on 16 June was 3,667. Note where the two peaks sit: below the January high, in a market that had already turned.
Gold and Bitcoin
In gold the double top didn’t work at all. Ten of the 12 signals were higher 60 sessions later, with a median gain of 4.5%, better than a random day. Nine of the 12 were back above the neckline within a week, and only two reached their target. Gold rose about fifteenfold over these 26 years, and the pattern couldn’t beat that.
Bitcoin is the one market where the signal looked like what the books describe. 120 days after the break the median was −10.0% and 27% were higher, against +9.1% and 60% for any day. Six of the 11 reached their target. The latest examples show both sides: the break on 16 October 2025 at $108,186 was 36% lower 120 days later, and the one on 29 March 2026 at $65,955 was 11.5% higher 60 days later. Eleven signals are not many, so I read it as a tilt, not a rule.
I also ran six variations of the rules: a 3% or 8% dip, peaks within 2% or 5%, a narrower window for peak 1, and peaks no more than 40 sessions apart. The picture held in all of them. The S&P 500 was weaker than normal after the signal, gold stronger than normal, Bitcoin weaker.
The most famous double top didn’t make the list
October 2007 is the chart everyone shows. The S&P 500 closed at 1,553 on 19 July and 1,565 on 9 October, 57 sessions apart and less than 1% different, with a low close of 1,407 on 15 August in between. The first close below that level came on 8 January 2008, 62 sessions after the second peak, so my 60-session rule missed it by two days, and the 9.4% dip was short of ChartSchool’s 10%. Sixty sessions after the break the index was only 1.4% lower. By 9 March 2009 it was 51% lower. A good example of why I don’t trust a pattern I can only define after the fact: change one number and the most famous top in a generation is in or out.
How I use a double top
My first stock strategy, years ago, was a mean-reversion swing system that tried to short double tops and buy double bottoms before they were obvious, holding for a few weeks. On the index, the data above says the confirmed version at a market high is not something I would short. What I do use is the neckline. If I am long and price closes below the low between two failed peaks, that is a level the chart gave me, and it is a reasonable place for a stop or for taking some exposure off. If someone does short the break, the stop belongs above the second peak, and they should expect to be tested: most breaks came back to the neckline within a week. It is the same lesson as my death cross study. A famous bearish signal mostly tells you the market has already fallen, which is useful to know and not the same as knowing what comes next.
FAQ
Is a double top bullish or bearish?
Bearish, by definition: it is read as a sign that an uptrend has failed twice at the same level. In my test the confirmed signal was mildly bearish on the S&P 500 and Bitcoin and not bearish at all in gold, where prices were usually higher 60 sessions later.
What comes after a double top pattern?
Usually not the textbook decline. On the S&P 500 since 1970 the measured-move target was reached within 60 sessions in 9 of 22 cases, and in 13 of 22 the price closed back above the neckline within a week. The typical result was a market that did a little worse than normal.
How reliable is a double top?
Less than its reputation. With 22 signals in 56 years on the S&P 500, half were higher 60 sessions later. All five double tops that started from a six-month high were higher. The ones that formed after the market had already fallen worked better, because the trend was already down.
What is a triple top?
The same idea with three peaks at about the same level before price breaks the low between them. It is rarer than a double top, and I haven’t tested it.
A double top is a story about buyers failing twice, and sometimes the story is true. On the index it was true mostly when the market was already going down. If you want to trade it, test it on your own market first and put the stop where the chart says the story is wrong.
Not financial advice. This is educational content, shared for information and entertainment only, and it is not a recommendation to buy or sell any asset. Backtests and past results do not guarantee future results, and the numbers or charts here may contain mistakes. Trading carries risk, including losing all the money you put in. Do your own research before you make any decision.