An EMA weights recent prices more, so it turns faster than an SMA of the same length. I tested both as a simple trend rule on the S&P 500 since 1988 and Bitcoin since 2015, at 20, 50, 100 and 200 days. Before costs the EMA did better in 7 of the 8 tests. After a cost of 0.25% per switch it was 4 of 8: the faster line trades more, and on the S&P the extra trades ate its edge.
What is the difference between an EMA and an SMA?
A simple moving average (SMA) adds up the last N closes and divides by N. Every day counts the same, and the oldest day drops out all at once. An exponential moving average (EMA) gives more weight to the latest close. The usual recipe, the one StockCharts’ ChartSchool uses, starts from the SMA and then moves the EMA each day by 2/(N+1) of the gap between the close and yesterday’s EMA. For a 200-day line that’s about 1% of the gap per day, for a 20-day line about 9.5%.
So the EMA hugs the price more closely and reacts sooner. That sounds like an advantage, and sometimes it is. It also means more false alarms.
What’s the difference between the 200 SMA and the 200 EMA?
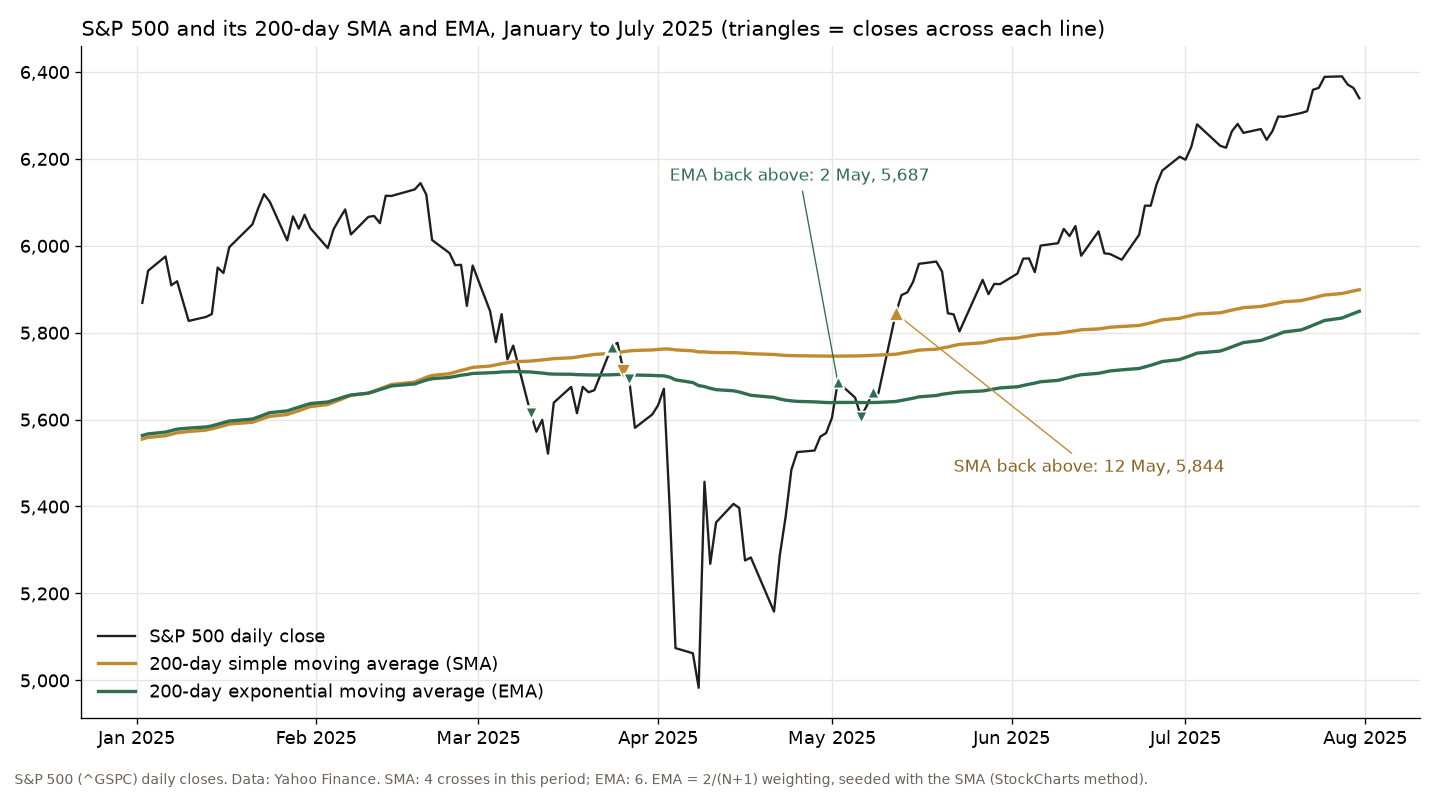
Spring 2025 on the S&P 500 shows it well. Both 200-day lines were broken on 10 March. The SMA version got back above on 12 May at 5,844 and stayed there. The EMA got back above on 2 May at 5,687, ten days earlier and 2.7% lower, but it fell back under on 6 May and crossed up again on 8 May. From January to July 2025 the price crossed the SMA four times and the EMA six times.
Which is better, EMA or SMA? The test
The rule is the same for both lines: hold the market while it closes above its moving average, hold 3-month T-bills while it closes below, and act from the next day. For the S&P 500 the signal is the index itself and the return includes dividends, the same setup as my S&P 500 200-day moving average test, from 4 January 1988 to 13 November 2026. For Bitcoin it’s the daily BTC-USD close from 13 July 2015 to 13 November 2026, the same as my Bitcoin 200-day moving average test. In each cell the first number is the return per year before costs, the second after 0.25% on every switch:
| S&P 500 | SMA, % | EMA, % |
|---|---|---|
| 20 days | 5.66 −1.93 |
6.02 −2.25 |
| 50 days | 6.59 1.93 |
7.28 1.98 |
| 100 days | 7.15 4.06 |
7.34 3.91 |
| 200 days | 9.20 7.40 |
9.40 7.34 |
Holding the S&P 500 made 11.40% a year, more than any of them. On the index the EMA was ahead at every length before costs, by 0.2 to 0.7 points a year. After costs it was ahead only at 50 days. At 200 days it switched 295 times against 257 for the SMA, and that was enough to flip the result.
| Bitcoin | SMA, % | EMA, % |
|---|---|---|
| 20 days | 67.57 52.15 |
74.51 58.39 |
| 50 days | 81.26 73.23 |
74.24 65.36 |
| 100 days | 69.45 64.26 |
70.32 64.37 |
| 200 days | 59.88 57.25 |
66.61 63.00 |
Holding Bitcoin made 61.77% a year. Here the EMA won at 20, 100 and 200 days, before and after costs, and lost at 50. The biggest gap was at 20 days, 74.51% against 67.57%. Bitcoin’s trends are big enough that getting in and out a few days sooner is worth more than the extra switches.
Which is better, the 20 EMA or the 50 EMA?
As a stand-alone rule, neither. On the S&P 500 the 20-day lines switched more than 1,100 times since 1988 and lost money after costs, with the SMA and the EMA alike. The 50-day did better but still made only about 2% a year after costs. Short averages can work as a guide on a chart. As a rule that buys every cross, they mostly pay commissions and spreads.
Should I use EMA or SMA for swing trading?
Use the one whose mistakes you can live with. The EMA gets you in and out sooner and whipsaws more. The SMA is calmer and later. Going faster still doesn’t fix it: my Hull moving average test on gold, a line built to lag less, held trades for about 10 days and made 1.7% a year against 11.0% for holding gold. In Holly and Steve Burns’ Moving Averages 101, which I reviewed, they use EMAs for the short lines (5, 10 and 21 days) and SMAs for the long ones (50, 100 and 200 days). My test doesn’t contradict that: on the S&P 500 the 100-day and 200-day SMA came out ahead once costs were counted.
What matters more than the type of average is the length, and whether you trade every cross. Across both markets the gap between the best and worst length was far bigger than the gap between EMA and SMA at the same length. I’d pick the length first, test it on the market I trade, and only then worry about the kind of average.
The EMA is the faster car. On a straight road it gets there first. On a winding one you pay for the extra braking.
Not financial advice. This is educational content, shared for information and entertainment only, and it is not a recommendation to buy or sell any asset. Backtests and past results do not guarantee future results, and the numbers or charts here may contain mistakes. Trading carries risk, including losing all the money you put in. Do your own research before you make any decision.