A bull flag is a sharp rise, a short pullback that drifts lower, and a breakout above the high. I tested 244 of them with fixed rules on the S&P 500, gold, Bitcoin and 10 large US stocks. On the S&P 500 the breakouts looked good: 80% were higher 20 sessions later, against 61% for any day. But 201 breakouts on the stocks were higher 57.2% of the time, against 56.8% for any day. Across the bigger sample, the pattern told me almost nothing.
What is a bull flag pattern?
It is a continuation pattern: the trend goes up fast, rests, and carries on. The fast part is the flagpole. The rest is the flag, a small channel that slopes gently down against the trend. The breakout is the first move above the top of the flag, and the usual reading is that the advance has resumed. Day traders like it, and Andrew Aziz lists bull flag momentum among the strategies in his book.
StockCharts’ ChartSchool gives the textbook version. The pole is a sharp advance, ideally on heavy volume, that breaks a resistance level. The flag usually lasts one to four weeks, and after 12 weeks it is a rectangle, not a flag. The target is the length of the pole added to the breakout. A pennant is the same idea with a small triangle instead of a channel.
How I tested it
A pattern you can only spot afterwards can’t be tested, so I wrote the rules down before I looked at any result and used daily closes only:
- The pole: a close that is a new 50-day closing high and is at least two typical 10-day moves above the lowest close of the previous 10 sessions. For the S&P 500 that is a 3.64% rise, for Bitcoin 11.11%.
- The flag: 5 to 20 sessions after that high, with no close above it, no close more than halfway back down the pole, and closes that slope downwards.
- The signal: the first close above the high of the pole.
Everything in the rules is known on the day of the signal, so there is no hindsight. I left volume out, because Yahoo’s volume for an index or for Bitcoin isn’t reliable enough to test. I ran the rules on the S&P 500 index from 1970, gold futures from 2000, Bitcoin from 2014, and Apple, Microsoft, Coca-Cola, Johnson & Johnson, Exxon Mobil, Procter & Gamble, IBM, General Electric, Walmart and JPMorgan from 1990, all to 30 October 2026 (Bitcoin, which trades at weekends, to 1 November). A separately written second program found exactly the same signals on the three markets.
Bull flag success rate: what the test found
| Market | After a breakout | Any day |
|---|---|---|
| S&P 500 (20) | 80% up +1.5% |
61% up +1.1% |
| Gold (13) | 62% up +0.6% |
56% up +0.8% |
| Bitcoin (10) | 70% up +8.4% |
56% up +1.6% |
| 10 stocks (201) | 57.2% up +1.0% |
56.8% up |
How often the price was higher 20 sessions after the breakout (for Bitcoin, which trades every day, 20 days), and the median change. The number of signals is in brackets. For the stocks, “any day” is the average of each stock’s own rate.
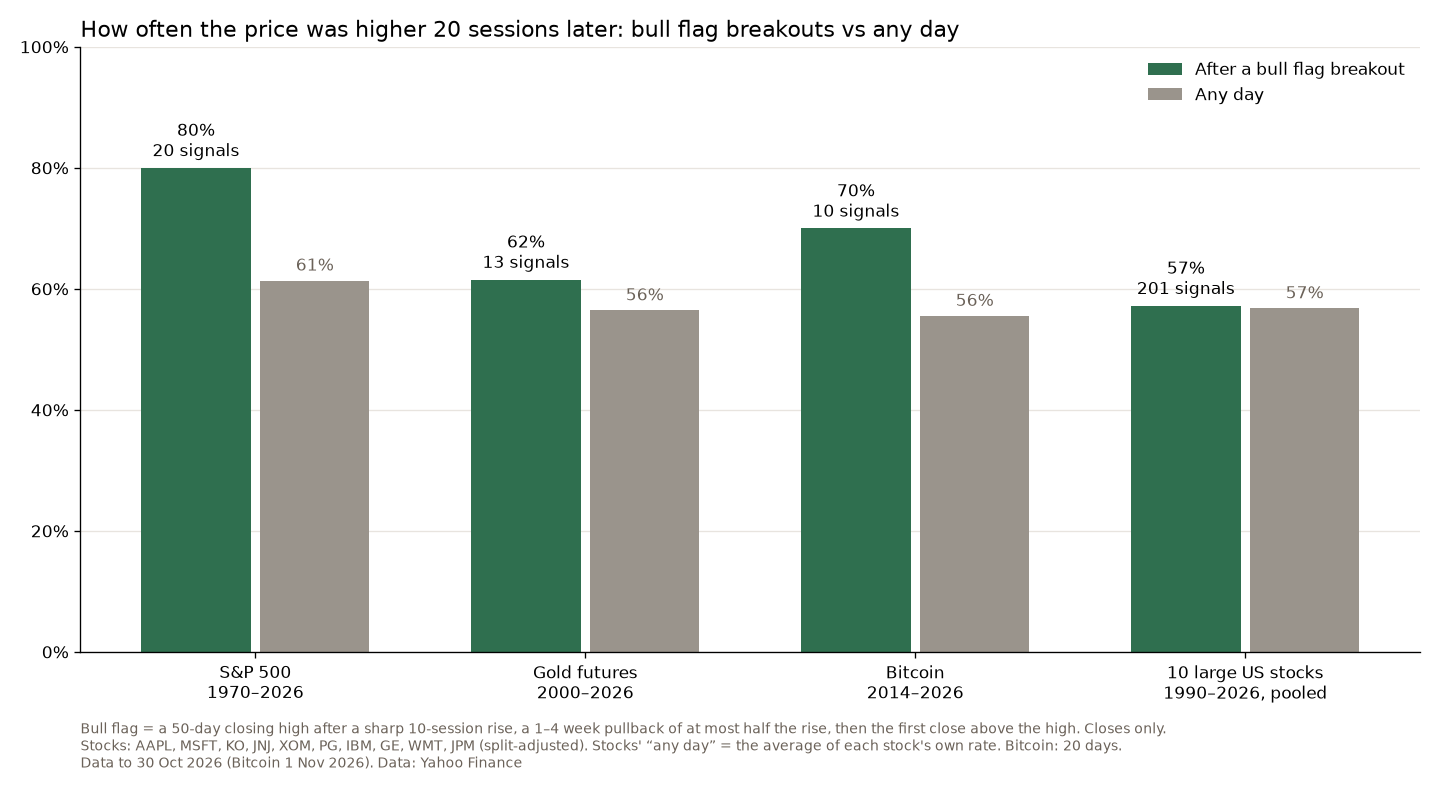
The S&P 500 result looks like an edge, but it rests on 20 signals in 56 years, and three of them came in 2021 alone. Over 60 sessions the median advantage was gone: +2.3% after a breakout against +2.7% from any day, even though 80% were still higher against 67%. The measured-move target was reached within 60 sessions 8 times out of 20.
Gold was up a little more often after 20 sessions, 62% against 56%, but by less (+0.6% against +0.8%), and over 60 sessions it did worse than any day, 54% against 63%. Bitcoin did well, with a median of +8.4% in 20 days against +1.6%, but ten signals in twelve years is not enough to tell skill from luck.
The stocks didn’t confirm it
This is why I added the stocks. With the same rules, ten large companies gave 201 breakouts, ten times more than the index. They were higher 20 sessions later 57.2% of the time, which is what you got from buying on any day. Over 60 sessions they did worse than any day, 57.8% against 61.4%. Two stocks stood out, JPMorgan (85% of 13) and Walmart (81% of 26). Seven of the ten were higher less often after a breakout than on their own average day. Apple (48% of 27), General Electric (44% of 18) and Exxon Mobil (47% of 15) were the furthest below. That is what noise looks like when you split a sample ten ways.
These are also today’s winners. A list of the largest companies of 1990 would include some that went nowhere or disappeared, and a test on survivors flatters any bullish pattern. Even with that tailwind, the bull flag didn’t beat a random day.
I also ran the rules with 27 combinations of pole size, flag length and pullback depth, and printed every one. On the S&P 500 the edge only showed with flags of one to four weeks. With quick flags of 3 to 15 sessions it disappeared. When a result depends that much on one setting, it usually means the setting found the sample, not a law of the market.
How I would use a bull flag
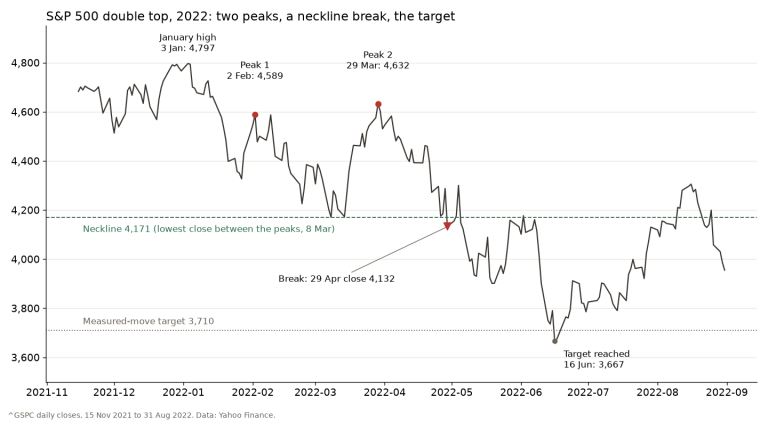
I wouldn’t trade it on its own. A flag is a picture of a market that went up and didn’t fall much, and that is already what a trend looks like. The breakout just says the trend is still there. My tests of the double top and the inside bar went the same way. The double top worked mainly when the market was already falling, and the inside bar breakout did no better than breaking any ordinary day’s range. The classical shapes carry less information than their reputation. If a flag helps you find a stock that is already in a strong uptrend, fine. But test it on your own market before you put money on the shape, and know where the trade is wrong before you enter it.
FAQ
What is the success rate of a bull flag pattern?
In my test, 57.2% of 201 breakouts on ten large US stocks were higher 20 sessions later, against 56.8% for any day. On the S&P 500 it was 80% of 20, against 61%. Success rates quoted without a test, a sample size and a comparison with any day don’t mean much.
How accurate is a bull flag?
Not much better than chance on the larger sample. The measured-move target was reached within 60 sessions in 106 of 199 stock breakouts, and the price was higher 60 sessions later less often than from a random day.
What is the difference between a bull flag and a bear flag?
A bear flag is the mirror image: a sharp fall, a short pullback that drifts upwards, and a break below the low. I tested only the bull flag here.
What does a bull flag look like?
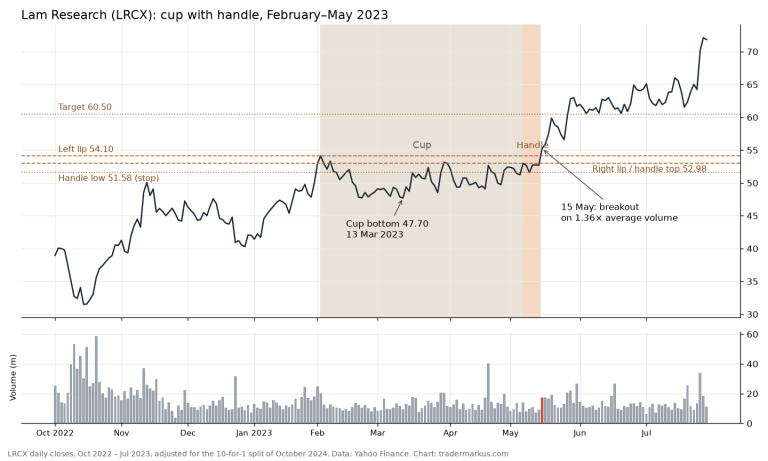
A steep line up, then a short, narrow channel that slopes slightly down, like a flag on a pole. If you are learning to read the shapes, start with how to read stock charts. The cup and handle is a slower relative of the same idea.
A bull flag is easy to see on a chart that has already played out. On 244 breakouts it mostly told me that a rising market had risen.
Not financial advice. This is educational content, shared for information and entertainment only, and it is not a recommendation to buy or sell any asset. Backtests and past results do not guarantee future results, and the numbers or charts here may contain mistakes. Trading carries risk, including losing all the money you put in. Do your own research before you make any decision.