The Sharpe ratio is the return you earned above cash, divided by how much the returns swung. Holding the S&P 500 with dividends since 1988 has given a Sharpe ratio of 0.53, gold 0.55 and Bitcoin 0.95. So over decades, anything near 0.5 is normal, 1 is very good, and a strategy that claims 3 for years on end deserves suspicion. The bigger lesson is how noisy the number is: the same S&P 500 showed anything from −0.96 to 3.43 in single years.
When I reviewed Robert Carver’s Systematic Trading I wrote that he focuses much on the Sharpe ratio, something I haven’t found useful myself. I still think that, but it is worth knowing what the number means, what a good one looks like on real data, and why I don’t lean on it.
What is the Sharpe ratio?
William Sharpe introduced it in 1966 to compare mutual funds, and called it the reward-to-variability ratio. His own later description is in “The Sharpe Ratio” (1994). In plain words:
Sharpe ratio = (return − risk-free rate) / standard deviation of the returns
The top is what you earned above a safe alternative, usually short-term Treasury bills. The bottom is how much the returns swung around their average. A Sharpe of 0.5 means that for every unit of swing you got half a unit of return above cash. Higher is better, and below zero means cash would have done better.
How to calculate the Sharpe ratio: a worked example
Here is 2024 for the S&P 500 with dividends, step by step, from daily data:
- Take each day’s return and subtract that day’s share of the 3-month T-bill rate. The T-bill averaged 4.97% in 2024.
- Average those 252 daily excess returns: 0.0717% a day.
- Take their standard deviation: 0.7981% a day.
- Divide: 0.0717 / 0.7981 = 0.0898. That is the daily Sharpe ratio.
- Annualize by multiplying by the square root of the number of trading days, √252 = 15.87: 0.0898 × 15.87 = 1.43.
Many sites use a shortcut with yearly numbers instead: the S&P 500 returned 25.02% in 2024, minus 4.97% for cash, divided by the yearly volatility of 12.67%, gives 1.58. The gap comes from compounding: the yearly return includes growth on growth, while the daily method averages simple daily returns. Neither is wrong, but they are not comparable, so when two sources give different Sharpe ratios for the same fund, check how each was calculated first.
What is a good Sharpe ratio? Three markets since the 1980s and 2000s
I calculated it the daily way for three things you can simply buy and hold, each against 3-month T-bills, to 11 November 2026: the S&P 500 with dividends from February 1988, gold from 2000 and Bitcoin from 2014.
| Sharpe | Sortino | |
|---|---|---|
| S&P 500 | 0.53 | 0.75 |
| Gold | 0.55 | 0.78 |
| Bitcoin | 0.95 | 1.39 |
The S&P 500 returned 11.5% a year with a volatility of 17.8%; gold 10.7% with 17.9%. Bitcoin returned 52.9% a year, but with a volatility of 65.9%, which is why its Sharpe ratio is “only” 0.95. That is the point of the ratio: it puts a calm 12% and a wild 53% on the same scale.
So my rough guide for a long record, years not months: around 0.5 is what a broad market gives you for doing nothing. Around 1 is very good. Well above 2 for many years is rare enough that I would want to know exactly how it was calculated. Under 0.5 means you would probably have done better holding an index fund.
Why one year’s Sharpe ratio means very little
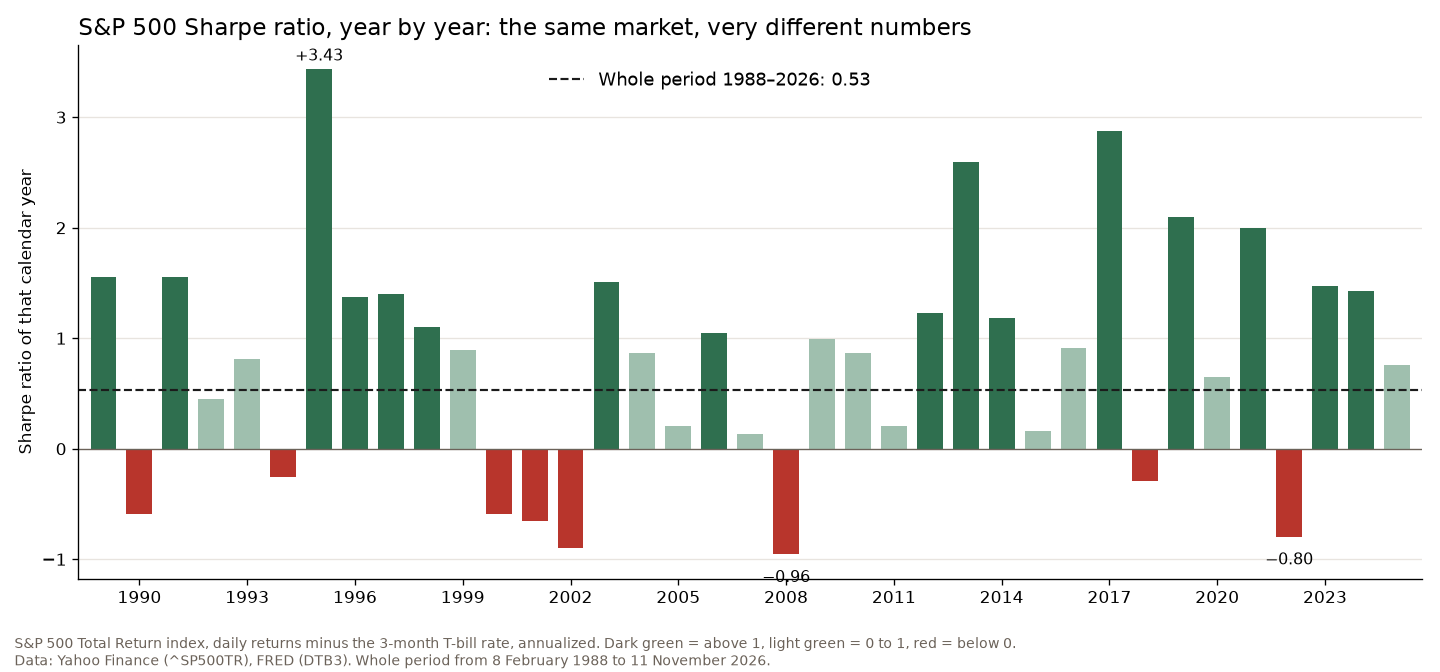
Same index, same method, one year at a time. The median year was 0.89. Sixteen of the 37 years were above 1, five above 2, and eight below zero. Nothing about the S&P 500 changed between 1995 (3.43) and 2008 (−0.96) except luck and the news.
To see how much of that is pure chance, I simulated a market with a true Sharpe ratio of exactly 0.5 and S&P-like volatility, thousands of times:
- 1 year of data: the measured Sharpe was above 1 in 31.3% of runs and below 0 in 31.3%. The middle 90% ran from −1.15 to 2.16.
- 5 years: above 1 in 13.2%, below 0 in 12.8%.
- 10 years: the middle 90% still ran from −0.02 to 1.04.
Sharpe made the same point in his 1994 paper: the t-statistic equals the Sharpe ratio times the square root of the number of returns. With yearly numbers and a true Sharpe of 0.5, you need 16 years before the t-statistic reaches 2. A trading course that shows you a Sharpe of 2 from last year has shown you very little.
Sharpe vs Sortino ratio
The Sharpe ratio punishes swings up as much as swings down. The Sortino ratio keeps the same top but divides only by the downside: the volatility of the days below the risk-free rate. Most traders don’t mind upside surprises, so the Sortino ratio is closer to what risk feels like. In the table above it comes out higher than the Sharpe for all three, as it usually does, because only the down days count in the bottom of the fraction. It is still built on volatility, though, so it still says nothing about a crash the data hasn’t had yet.
Why I still don’t lean on it
Volatility isn’t the risk I worry about. A strategy can show a smooth equity curve and a fine Sharpe ratio right up to the day it blows up, because selling options or adding to losers looks calm until it isn’t. The numbers I look at first are the deepest drawdown, how long it lasted, and the chance of losing half the account, which I simulated in risk of ruin. Nick Radge lists the Sharpe ratio as one of a dozen measures in Unholy Grails, next to CAGR, drawdown, exposure and the MAR ratio, and that is where I would leave it: one number among several, useful for comparing two things over the same long period, not a grade for last year.
And for scale: a plain S&P 500 index fund gives you about 0.5 for free. Any active strategy should be measured against that, after costs, over many years. The S&P 500’s average return is the hurdle for the top of the ratio, too.
FAQ
What is the Sharpe ratio of the S&P 500?
About 0.53 for the S&P 500 with dividends from February 1988 to November 2026, using daily returns against 3-month T-bills. Single calendar years ranged from −0.96 (2008) to 3.43 (1995).
What does a Sharpe ratio of 0.5 mean?
For every unit of volatility you earned half a unit of return above cash. Over long periods that is roughly what holding a broad stock market has paid.
Is a Sharpe ratio of 2 or 3 good?
Over one year, it can be luck: a market with a true Sharpe of 0.5 showed above 2 in 6.8% of simulated single years. Held over many years, 2 or 3 would be exceptional, so check the calculation, the costs and the length of the record before believing it.
How do you calculate the Sharpe ratio?
Subtract the risk-free rate from each period’s return, divide the average of those excess returns by their standard deviation, and multiply by the square root of the number of periods in a year (√252 for daily stock data).
The Sharpe ratio is a good way to compare two records of the same length. As a promise about next year, it is close to useless.
Not financial advice. This is educational content, shared for information and entertainment only, and it is not a recommendation to buy or sell any asset. Backtests and past results do not guarantee future results, and the numbers or charts here may contain mistakes. Trading carries risk, including losing all the money you put in. Do your own research before you make any decision.