Since 1972, the first full year after the US stopped exchanging dollars for gold, the S&P 500 with dividends returned 11.06% a year and gold 8.89%. Stocks won the long run. But gold beat the S&P 500 in 23 of those 54 years, rose in 7 of the index’s 11 losing years, and was ahead over the most recent 20 years. The two take turns more than the long-run average suggests.
Most “gold vs S&P 500” pages give you a calculator and one line on a chart. The useful questions are how often each one wins, and what gold does in the years stocks fall.
Gold vs S&P 500 since 1972
I used the yearly returns that Aswath Damodaran of NYU Stern publishes for the S&P 500, dividends included, and for gold. The start is 1972, the first full year after August 1971, when the US stopped exchanging dollars for gold with foreign governments at a fixed $35 an ounce. Over the 54 years to the end of 2025, a dollar in the S&P 500 grew to $288.7 and a dollar in gold to $99.5.
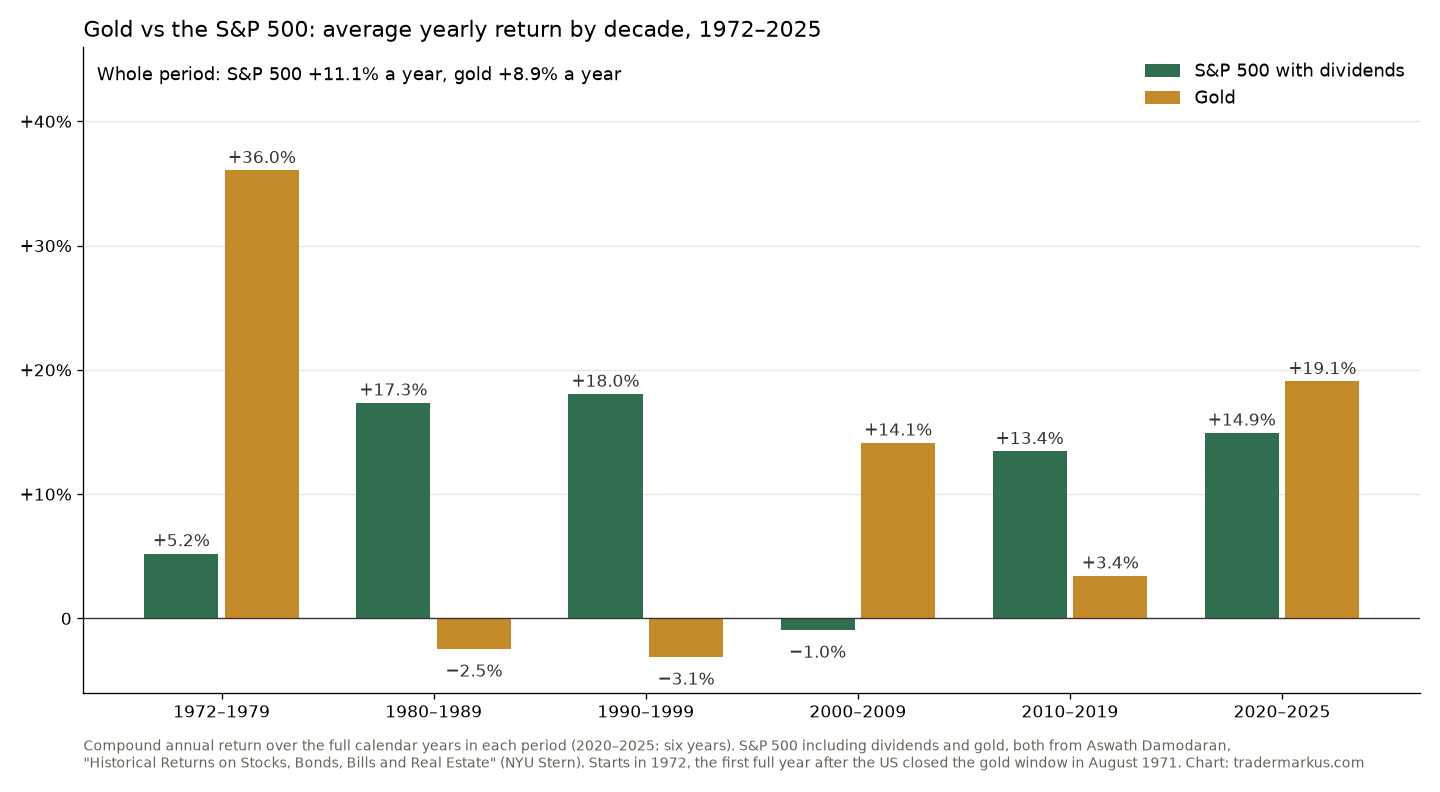
The average hides a very uneven ride. Here is the yearly return by decade:
| Period | S&P 500 | Gold |
|---|---|---|
| 1972–1979 | +5.2% | +36.0% |
| 1980–1989 | +17.3% | −2.5% |
| 1990–1999 | +18.0% | −3.1% |
| 2000–2009 | −1.0% | +14.1% |
| 2010–2019 | +13.4% | +3.4% |
| 2020–2025 | +14.9% | +19.1% |
Compound yearly return over the full calendar years in each period. S&P 500 including dividends. Data: Damodaran.
Gold won the 1970s, the 2000s and the six years from 2020 to 2025. Stocks won the 1980s, 1990s and 2010s, and in two of those decades gold lost money. Whoever was ahead at the end of a decade was a poor guide to the next one.
How often does gold beat the S&P 500?
In single years, gold came out ahead 23 times out of 54. Over any 10 calendar years in a row, it was ahead in 13 of the 45 windows, mostly the ones that started in the early 1970s or ran through the 2000s. Over 20 years it was ahead in 8 of 35 windows, and one of them is the most recent: 2006 to 2025.
Gold also swings harder. The standard deviation of its yearly returns was 27.1%, against 16.9% for the S&P 500. Its best year was 1979, up 126.6%, and two years later, in 1981, it lost 32.6%. Gold futures fell 44.4% from 22 August 2011 to 17 December 2015, which is a long time to hold something that pays nothing while you wait.
What does gold do when stocks fall?
This is the part that makes gold interesting. The S&P 500 lost money in 11 of the 54 years. Gold rose in 7 of them: by 73.0% in 1973, 66.2% in 1974, 22.6% in 1977, 25.6% in 2002 and 4.3% in 2008, and by less than 1% in 2001 and 2022. In the other four, 1981, 1990, 2000 and 2018, it fell too.
Across all 54 years the correlation between the two was −0.17: close to zero, slightly negative. Gold doesn’t reliably go up when stocks go down, but it mostly moves on its own, and that is worth something in a portfolio.
Has gold outperformed the S&P 500 since 2000?
Yes. From the start of 2000 to the end of 2025, a dollar in gold grew to $14.95 and a dollar in the S&P 500 with dividends to $7.39. On daily prices, from 30 August 2000 to 17 November 2026, gold futures were up 14.1 times and the S&P 500 with dividends 7.9 times. The start date does a lot of work here: 2000 was near the top for stocks and near the bottom for gold.
Why Warren Buffett doesn’t buy gold
In his 2011 letter to Berkshire shareholders, dated 25 February 2012, Buffett called gold “neither of much use nor procreative”. His point is that a business produces earnings and farmland produces crops, while an ounce of gold stays an ounce. He wrote it with gold at about $1,750. From the close before the letter’s date to 17 November 2026, gold futures went up 2.2 times and the S&P 500 with dividends 7.0 times. On that stretch, he was right.
2026 so far
Gold had a huge 2025, up 66.2% in Damodaran’s numbers. Up to 17 November 2026 it gave part of that back: gold futures were down 11.0% for the year, while the S&P 500 with dividends was up 8.3%. That left gold only narrowly ahead for the 2020s so far. Where gold stands each week, with the levels I watch, is on my weekly levels page.
My view
Over the long run stocks have the better case, for Buffett’s reason: companies earn money and pay some of it out, gold doesn’t. The S&P 500’s average return is hard to beat with anything that has no income.
But the data doesn’t support treating gold as dead money either. It had three good decades out of six, it rose in most of the stock market’s bad years, and it moves mostly on its own. For me it is a market to trade with levels and a stop, not a replacement for stocks, and I treat its swings with respect: a 44% fall over four years is not a hedge, it’s a separate risk.
If you’re thinking about gold through a fund, read about leveraged gold ETFs before you buy one, and the Sharpe ratio post compares gold’s risk and return with the S&P 500 and Bitcoin.
FAQ
Does gold perform better than the S&P 500?
Not over the long run: since 1972 the S&P 500 with dividends returned 11.06% a year against 8.89% for gold. But gold was ahead in 23 of the 54 years and over the most recent 20-year stretch, 2006 to 2025.
What if you invested $1,000 in gold 10 years ago?
$1,000 in gold futures on 17 November 2016, at $1,216.50 an ounce, would have been worth $3,176 on 17 November 2026. The same $1,000 in the S&P 500 with dividends reinvested would have been worth $3,953.
Is gold a hedge against a stock market crash?
Sometimes. Gold rose in 7 of the 11 years the S&P 500 fell since 1972, including 2008, but it fell in 1981, 1990, 2000 and 2018. It is a diversifier, not insurance.
Not financial advice. This is educational content, shared for information and entertainment only, and it is not a recommendation to buy or sell any asset. Backtests and past results do not guarantee future results, and the numbers or charts here may contain mistakes. Trading carries risk, including losing all the money you put in. Do your own research before you make any decision.