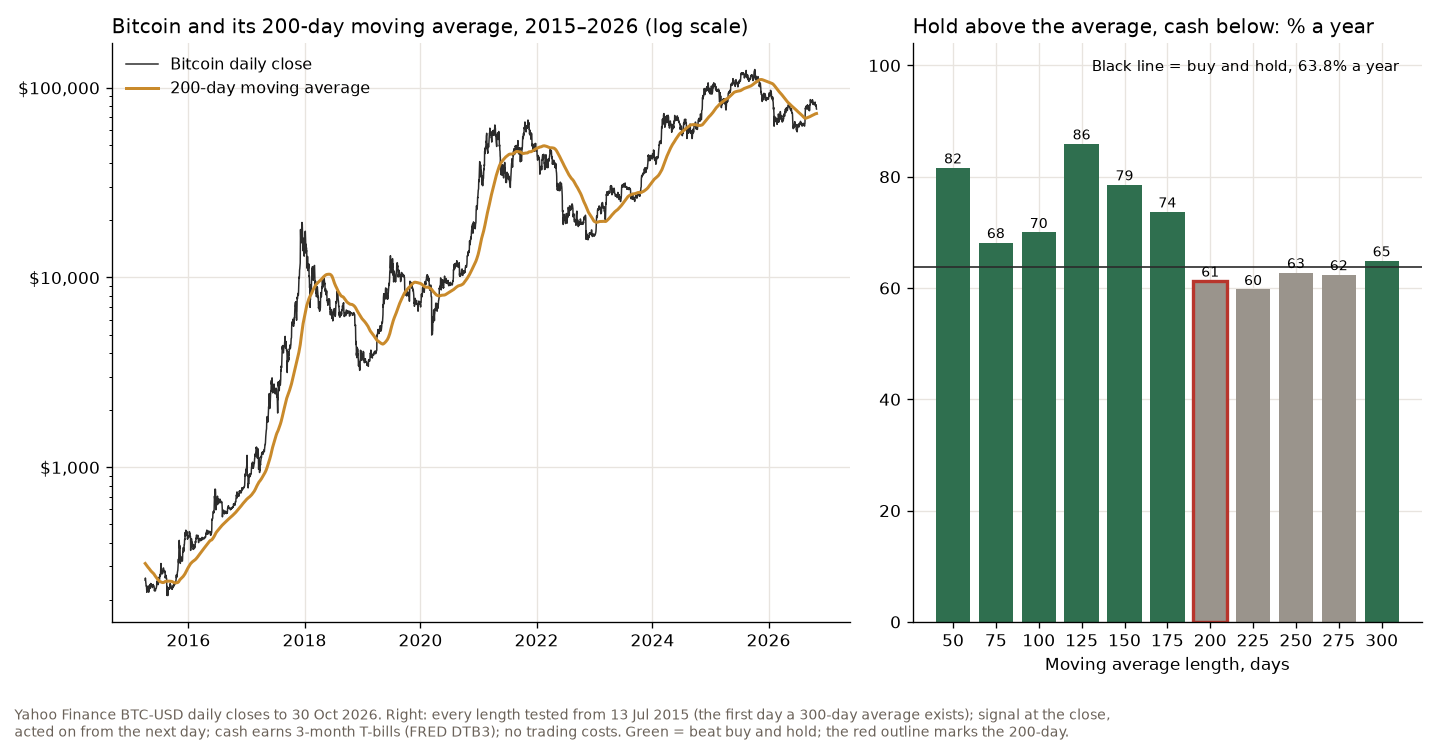
Bitcoin’s 200-day moving average was $73,115 on 30 October 2026, and Bitcoin closed 5.6% above it. Since April 2015 it has closed above the line on 61% of days. Used as a rule, owning Bitcoin above the line and holding cash below it, the 200-day cut the worst fall from 83% to 70% but made less than simply holding: 61.2% a year against 63.9%. Shorter averages did better, and the famous 200-day was one of the weakest of the 11 lengths I tested.
What is Bitcoin’s 200-day moving average?
It’s the average of the last 200 daily closes, recalculated every day. On a stock chart that is about 40 weeks of trading. Bitcoin trades every day, weekends included, so on Bitcoin the 200-day average covers 200 calendar days, a little under 29 weeks. That makes it faster than the same line on the S&P 500, and much faster than the 200-week moving average, which spans almost four years.
I used Yahoo Finance’s daily BTC-USD closes from September 2014 to 30 October 2026, with no missing days in that range. The first 200-day average exists on 4 April 2015.
Is Bitcoin above its 200-day moving average now?
Yes. At the 30 October close of $77,198, Bitcoin was 5.6% above its 200-day average of $73,115. It has closed above the line every day since 19 August 2026, 73 days in a row, and the average itself has risen 2.6% over the last 30 days. Being 5.6% above is not unusual for Bitcoin: on 58% of all days since 2015 it was further above than that. The extremes were 293% above on 7 December 2017 and 52% below on 18 June 2022.
Does the 200-day predict where Bitcoin goes next?
A little. Here is Bitcoin’s median change after a close above the line and after a close below it, from April 2015 on:
| Close | 1 month | 3 months | 1 year |
|---|---|---|---|
| Above | +4.2% | +16.0% | +98.1% |
| Below | +2.1% | +1.5% | +56.1% |
Above the line, the next three months were up 66.1% of the time; below it, 51.8%, close to a coin flip. A year later Bitcoin was higher about 72% of the time from either side, because the long-term trend was so strong. So below the 200-day has meant weaker and choppier, not necessarily lower.
How often does Bitcoin cross its 200-day moving average?
Often. Bitcoin closed below the line 37 times since April 2015, about three times a year. In 22 of those 37 cases it was back above within 10 days. The median stretch above the line lasted only 5 days, because many crosses are short back-and-forths around it. The long stretches are what matter: the longest ran 846 days, from 13 October 2015 to 4 February 2018.
The 200-day rule on Bitcoin: hold above, cash below
The rule: own Bitcoin while the close is above its 200-day average, hold cash earning the 3-month T-bill rate while it is below, and act on each close from the next day. From April 2015 to 30 October 2026 that made 61.2% a year with a worst fall of 70%. Buying and holding made 63.9% a year with a worst fall of 83%. The rule switched 75 times and was in Bitcoin 61% of the time. With a cost of 0.25% on every switch it made 58.6%.
The same rule from January 2020 gives the same picture: 36.0% a year against 41.5% for holding, with a worst fall of 64% against 77%. The 200-day took a big piece out of the drawdowns and gave up some return for it.
What is the best moving average for Bitcoin?
I ran the same rule with every length from 50 to 300 days, all from 13 July 2015, the first day a 300-day average exists, so every length is measured on the same days. “After costs” charges 0.25% on every switch:
| Days | % a year | After costs | Worst fall |
|---|---|---|---|
| 50 | 81.6% | 73.5% | −57% |
| 75 | 68.2% | 61.8% | −59% |
| 100 | 70.0% | 64.8% | −60% |
| 125 | 85.9% | 82.9% | −60% |
| 150 | 78.6% | 75.6% | −61% |
| 175 | 73.7% | 71.2% | −63% |
| 200 | 61.3% | 58.6% | −70% |
| 225 | 59.7% | 56.5% | −69% |
| 250 | 62.8% | 60.1% | −64% |
| 275 | 62.4% | 59.7% | −66% |
| 300 | 64.9% | 62.3% | −67% |
| Hold | 63.8% | 63.8% | −83% |
Every length had a smaller worst fall than holding. Seven of the 11 made more than holding: every length from 50 to 175 days, plus the 300-day by about a point. After costs the 75-day and the 300-day fell below holding; the short averages pay for their extra switches (205 for the 50-day, 74 for the 200-day). The 200-day, the one everybody quotes, was the second worst.
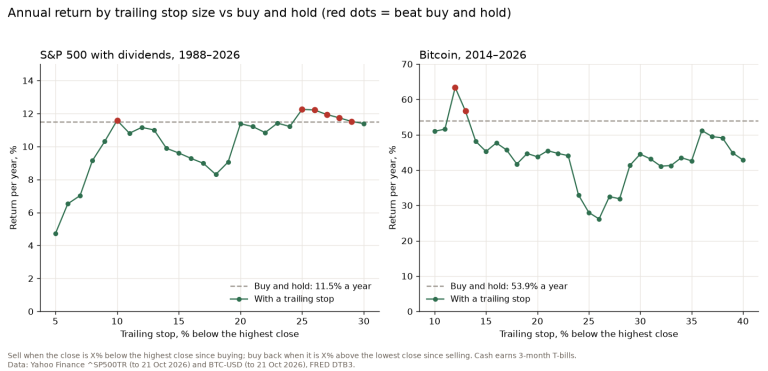
That doesn’t make the 125-day the answer. It came out best because of how Bitcoin’s booms and busts happened to line up over these 11 years, and picking it now would be choosing the winner after the race. I found the same thing when I tested trailing stops of every size: which setting worked best was mostly luck. What did hold across every length is the drawdown: a trend filter took roughly 13 to 27 points off Bitcoin’s worst fall.
How I read the 200-day on Bitcoin
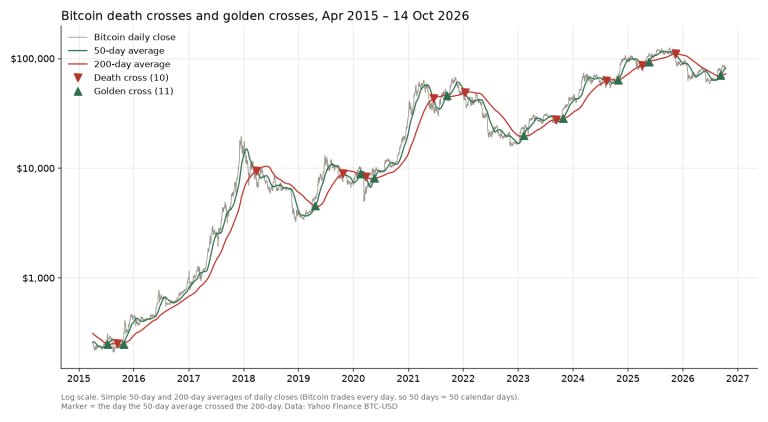
The same way as on the S&P 500, where I use the 200-day moving average as a map, not a trigger: the line tells you more about risk than about returns. On Bitcoin the risk side is just bigger. Below the line the next three months were close to a coin flip, and Bitcoin spent all of 2022 and 82% of 2018 below it. The 50-day and 200-day crossing each other is a separate signal, which I tested in the Bitcoin death cross post.
FAQ
What is Bitcoin’s 200-day moving average right now?
It was $73,115 at the 30 October 2026 close, with Bitcoin at $77,198, 5.6% above it. It changes every day, so check a current chart before you use it.
Is it a 200-day or 200-week moving average for Bitcoin?
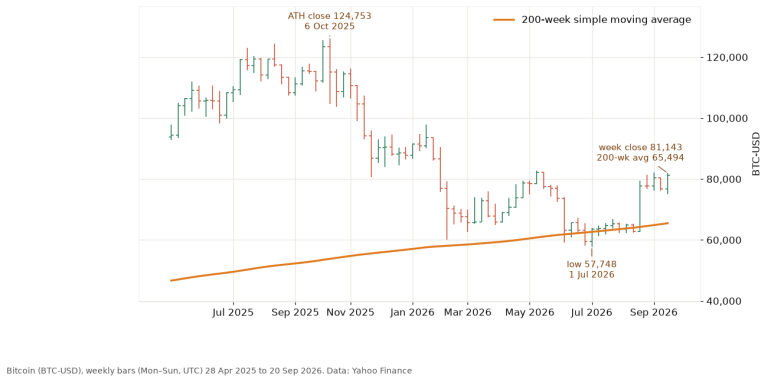
Both are used, for different jobs. The 200-day covers about 29 weeks and works as a trend filter. The 200-week covers almost four years, about one halving cycle, and is watched as a long-term floor; Bitcoin has closed above it on 88% of weeks.
Does Bitcoin always bounce off the 200-day moving average?
No. It crossed below the line 37 times since 2015, and 22 of those times it was back above within 10 days. The other 15 included the long bear markets of 2018, 2022 and 2025–2026.
The 200-day on Bitcoin is a good risk gauge and a mediocre trading rule, and the length that worked best in hindsight is not one you could have picked in advance.
Not financial advice. This is educational content, shared for information and entertainment only, and it is not a recommendation to buy or sell any asset. Backtests and past results do not guarantee future results, and the numbers or charts here may contain mistakes. Trading carries risk, including losing all the money you put in. Do your own research before you make any decision.