Bitcoin has had 10 death crosses since 2015, the days its 50-day moving average fell below the 200-day. A year later the price was higher after 5 of the 9 that are old enough to check. That is worse than a random day (72% were higher a year later), but it is far from the sell signal the headlines make of it. Three of the ten were followed by losses of 40% or more a year later. Four came close to a low and were followed by big gains.
What is a Bitcoin death cross?
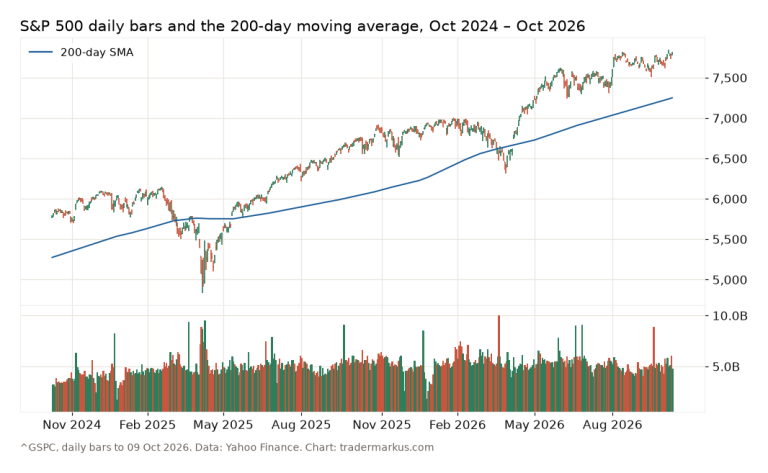
It’s the same signal as on a stock chart: the 50-day simple moving average of the daily close crosses below the 200-day. The opposite, the 50-day crossing back above, is the golden cross. I tested the death cross on the S&P 500 earlier, in what 27 S&P 500 death crosses since 1971 show, and there it told you almost nothing.
There’s one difference on Bitcoin. It trades every day, weekends included, so the 50-day average covers 50 calendar days, about seven weeks. On a stock it is about ten weeks. The Bitcoin averages react faster, and they cross more often.
I used Yahoo Finance’s daily BTC-USD closes from September 2014 to 14 October 2026, with no missing days. The first 200-day average is on 4 April 2015. Other sites use other data and other closing times, so a cross can be dated a day apart; the latest one, 16 November 2025, matches the date CoinDesk reported.
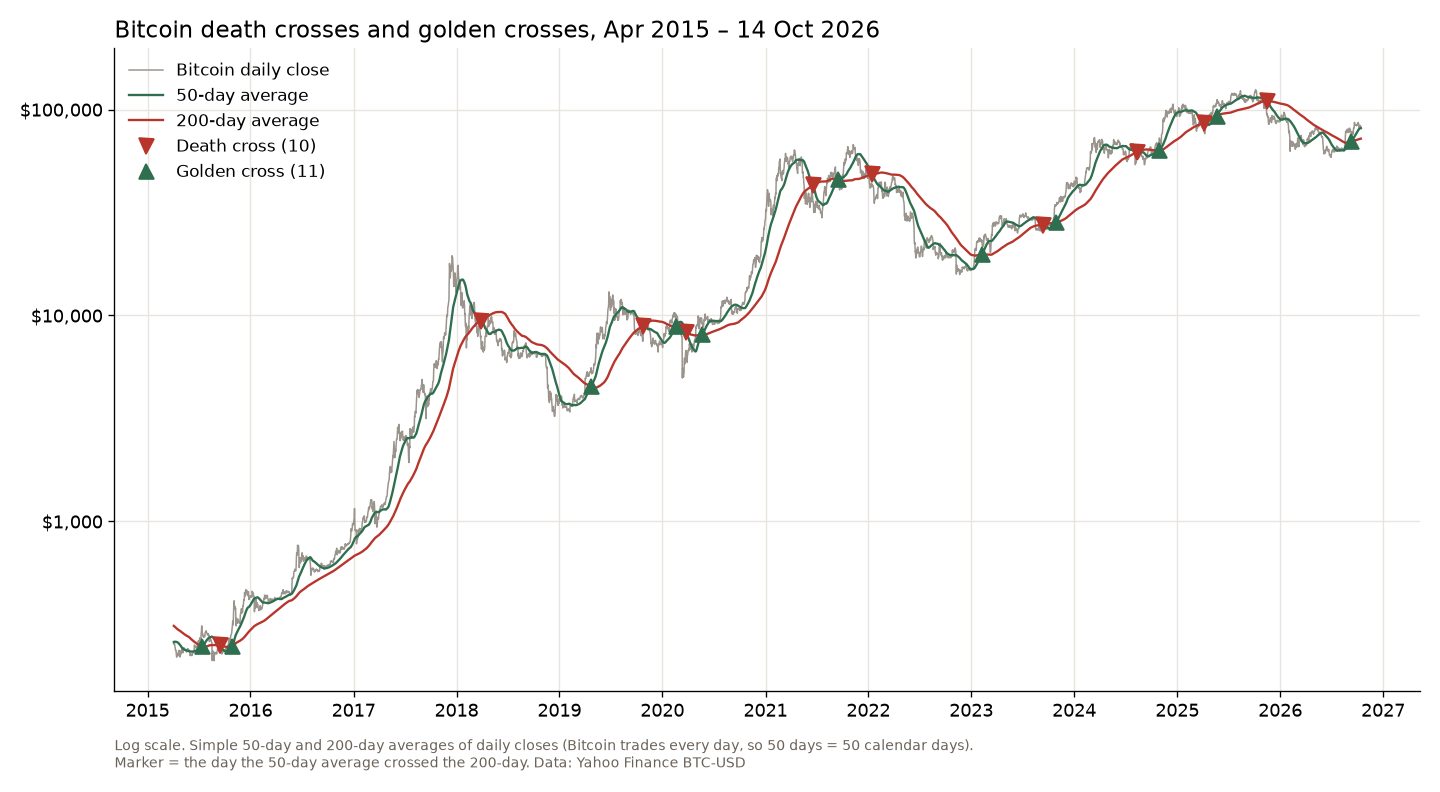
Every Bitcoin death cross since 2015
For each cross I took the close on the day, the close 365 days later, and the lowest daily low in between. That last one is the worst drop you would have sat through if you held.
| Death cross | A year later |
Worst drop |
|---|---|---|
| 14 Sep 2015 | +164% | −2% |
| 30 Mar 2018 | −40% | −54% |
| 26 Oct 2019 | +41% | −56% |
| 25 Mar 2020 | +674% | −12% |
| 19 Jun 2021 | −42% | −50% |
| 14 Jan 2022 | −51% | −64% |
| 12 Sep 2023 | +122% | −0.2% |
| 10 Aug 2024 | +96% | −14% |
| 7 Apr 2025 | −9% | −24% |
| 16 Nov 2025 (not a year yet) |
N/A | −39% (so far) |
The bad ones are the ones people remember. March 2018 came after the 2017 top, and Bitcoin was still 40% lower a year later. January 2022 came on the way into the 2022 bear market: −51% after a year, −64% at the worst. The October 2019 cross is a strange one: a year later the price was up 41%, but in between it went through the March 2020 crash and a 56% drop.
Then there are the crosses that came at the bottom. September 2015, March 2020, September 2023 and August 2024 were all followed by gains of 96% to 674% over the next year. The 2020 one came on 25 March, less than two weeks after the COVID crash low of 12–13 March. The averages were still catching up with the crash while the price had already turned, and anyone who sold on the cross sold close to the bottom.
Is the death cross bearish for Bitcoin?
A little, on average. Here is how the year after a death cross compares with the year after any day since April 2015, and after a golden cross:
| A year later | Higher | Median |
|---|---|---|
| Death cross | 56% (5 of 9) |
+41% |
| Golden cross | 80% (8 of 10) |
+101% |
| Any day | 72% | +80% |
So after a death cross Bitcoin did worse than usual, and the median worst drop in the following year was 31%, against 16% after a golden cross. That’s a real difference. But nine signals is a tiny sample, and the spread is enormous: from −51% to +674%. On the S&P 500 the death cross made no difference at all. On Bitcoin it makes some difference, and you still can’t trade it on its own.
The other problem is whipsaws. Four of the ten death crosses were undone by a golden cross within 60 days: September 2015 after 44 days, March 2020 after 57, September 2023 after 48 and April 2025 after 45. In February 2020 it went the other way: a golden cross, then a death cross 35 days later. A signal that flips back that fast mostly tells you the market is going sideways.
The latest Bitcoin death cross
The last death cross was on 16 November 2025, with Bitcoin at $94,177. It was the right call for a while. The lowest daily low since then was $57,748 on 1 July 2026, 39% below the cross. The 50-day average climbed back above the 200-day on 8 September 2026, a golden cross at $78,439, 296 days after the death cross.
On 14 October 2026 Bitcoin closed at $81,562, 13% above its 200-day average of $72,205. The death cross is over, and the trend on this chart is up again. That says nothing about next month. It is just where the averages are.
How I use it
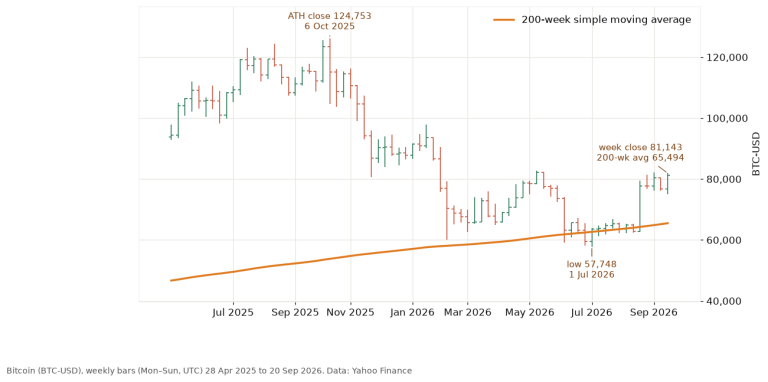
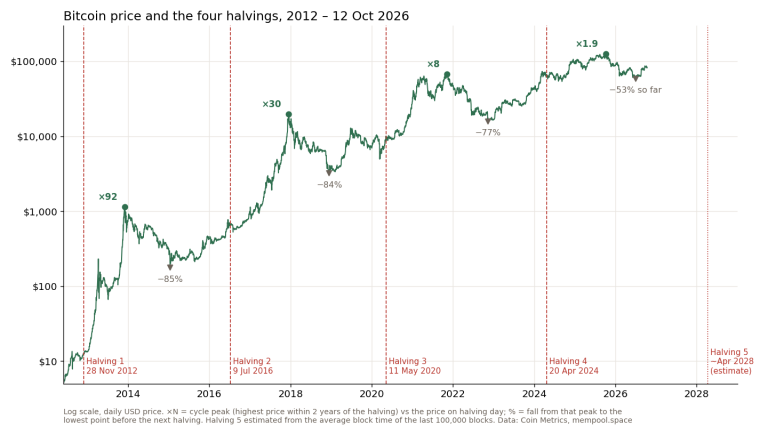
I don’t sell Bitcoin because of a death cross, and I don’t buy it because of a golden one. The cross is two averages of past prices meeting. By the time it happens, the price has usually been falling for weeks, which is why so many of these crosses came near a low rather than near a top. For the big picture I find the 200-week moving average more useful: Bitcoin closed below it in only 50 of 428 weeks between 2018 and September 2026, and those weeks lined up with its worst stretches. The halving cycle says more about the size of the falls. And the Setup Lab test of the golden cross on the S&P 500 shows what trading the cross on its own does over decades: a smaller worst fall, a lower return.
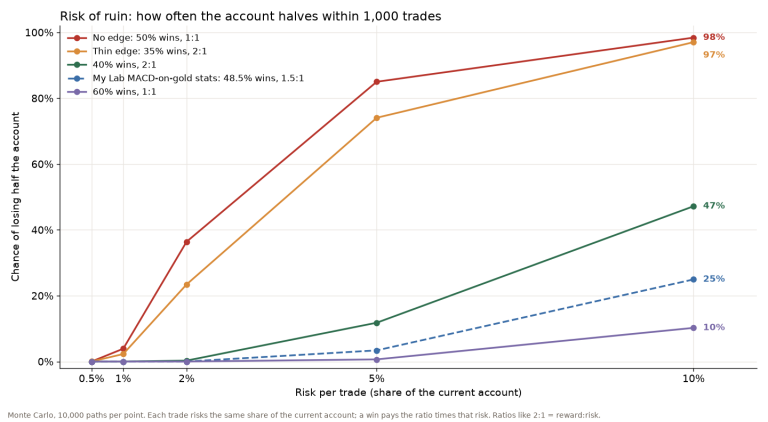
What the death cross is good for is a check on yourself. If you’re buying Bitcoin while its 50-day is below the 200-day, you’re buying into a downtrend. That can work, and it often has, but size it for a 50% drop, because that’s what the bad ones delivered. Buying just because the price is moving is the FOMO trade, and the cross doesn’t fix that.
FAQ
What is a death cross in Bitcoin?
The day Bitcoin’s 50-day moving average falls below its 200-day moving average. Because Bitcoin trades every day, both averages count calendar days, not trading days.
Is a death cross good or bad for Bitcoin?
On average a bit bad: a year later Bitcoin was higher after 5 of 9 death crosses, against 72% of all days. But four of them came close to a bottom and were followed by gains of 96% or more. It is not a reliable sell signal.
How often does Bitcoin have a death cross?
Ten times between April 2015 and October 2026, about once a year. The 50-day average was below the 200-day on 39% of the days.
A death cross on Bitcoin is a fact about the last 200 days, not a forecast. Some of the best buying days in its history had one.
Not financial advice. This is educational content, shared for information and entertainment only, and it is not a recommendation to buy or sell any asset. Backtests and past results do not guarantee future results, and the numbers or charts here may contain mistakes. Trading carries risk, including losing all the money you put in. Do your own research before you make any decision.