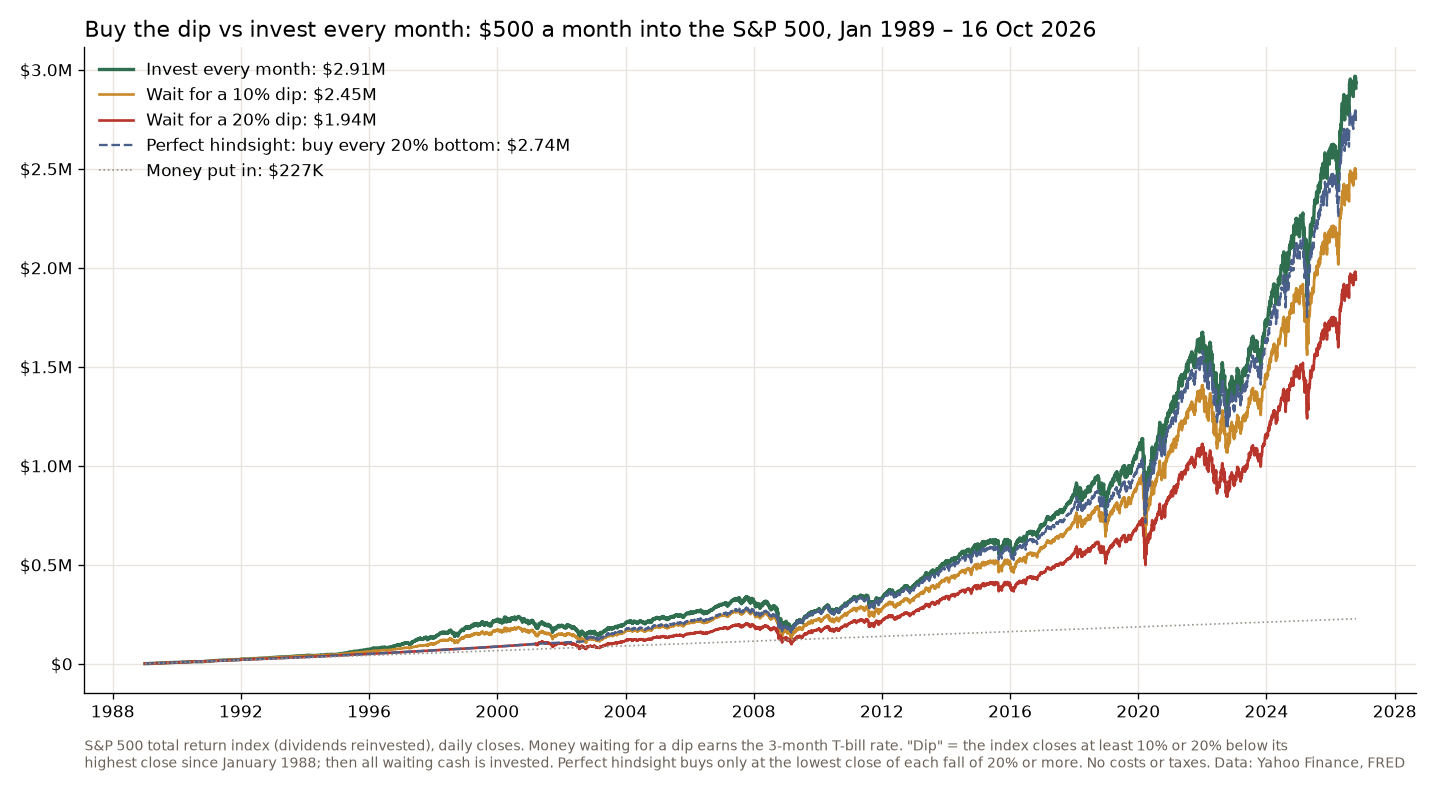
Buying the dip means keeping cash aside and investing it when the market falls. I tested it on the S&P 500 with dividends since 1989: $500 a month, either invested right away or held in T-bills until the index was 10% or 20% below its high. Investing every month ended with $2.91 million. Waiting for a 10% dip ended with $2.45 million, and waiting for 20% with $1.94 million. In every one of 215 twenty-year periods, the 10% and 20% rules finished behind. Even a buyer who knew the exact bottom of every 20% crash ended the 38 years with less.
What does “buy the dip” mean?
It means buying after the price has fallen, on the idea that you get the same market cheaper. For a trader it can mean buying a stock that dropped 3% this morning. For an investor it usually means something bigger: keep some money ready, and put it to work when the market has a real fall. That second version is the one I tested here, because it’s the one people use with their savings.
The idea is easy to like. Nobody wants to invest at the top, and every chart of the S&P 500 shows falls that look like gifts in hindsight. The catch is the waiting. Money that waits for a dip isn’t in the market while the market goes up, and the market spends most of its time going up.
How I tested it
I used the S&P 500 total return index from Yahoo Finance, which includes dividends, daily from January 1988 to 16 October 2026. Every month, on the first trading day from January 1989, $500 comes in. That’s 454 months and $227,000 in total.
- Invest every month: the $500 goes into the index the day it arrives.
- Buy the dip at 10% or 20%: the money waits in 3-month T-bills (FRED data) until the index closes at least 10% or 20% below its highest close so far. Then all the waiting cash is invested, and while the index stays that far down, each new $500 goes in straight away.
- Perfect hindsight: the cash waits until the exact lowest close of every fall of 20% or more, and is invested there. Nobody can do this. It shows the best case.
No costs, no taxes, and the highs are counted from January 1988, where the data starts.
Does buying the dip work? The results
| Strategy | End value |
|---|---|
| Invest every month | $2,907,316 |
| Wait for a 5% dip | $2,893,373 |
| Wait for a 10% dip | $2,451,322 |
| Wait for a 20% dip | $1,940,189 |
| Perfect hindsight, 20% falls | $2,740,678 |
The deeper the dip you wait for, the worse it gets. A 5% dip comes along so often that the rule is almost the same as investing every month. A 10% dip cost about $456,000 over the whole period. A 20% dip cost almost a million.
One long run could be luck, so I also looked at every 20-year period that starts on the first trading day of a month, from January 1989 to November 2006: 215 of them. The 10% rule finished behind investing every month in all 215. In the median period it was 2.8% behind, and in the worst one, starting in February 1991, it was 22.9% behind. The 20% rule also lost all 215, by 4.5% in the median period and up to 37.3%. The 5% rule won 32 of them, never by more than 0.3%.
Why waiting for a big dip costs so much
Because the big dip often doesn’t come. In 1990, 1998, 2018 and April 2025 the S&P 500 with dividends fell 19.2%, 19.2%, 19.4% and 18.7%. Each time it stopped just short of 20%. The 20% rule saw none of them. It sat in T-bills from January 1989 until 12 March 2001, while the market had one of its best decades, and bought in only on the way into the 2000–2002 bear market.
The perfect-hindsight buyer had it even worse at the start. The first fall of 20% or more in the data bottomed on 9 October 2002, so all the money from 1989 waited almost 14 years for its first purchase. After that, it bought the bottoms of 2009, 2020 and 2022 to the day, and still ended the 38 years $167,000 behind someone who just invested every month.
To be fair to it: perfect hindsight beat monthly investing in 207 of the 215 twenty-year periods, because every one of those periods includes the 2002 and 2009 bottoms. That shows what buying the dip could be worth if you knew where the bottom was. Nobody does. The rules you can actually follow, 10% and 20%, never won.
Should you buy the dip right now?
I can’t tell you what the market does next, and neither can anyone else. What the test says is that the question is the wrong one for money you’re investing for years. If the money is ready, the history says invest it. If you get extra cash during a fall, investing it then is fine, because it’s the same as investing it right away. Holding cash back on purpose, waiting for a fall, is the part that costs.
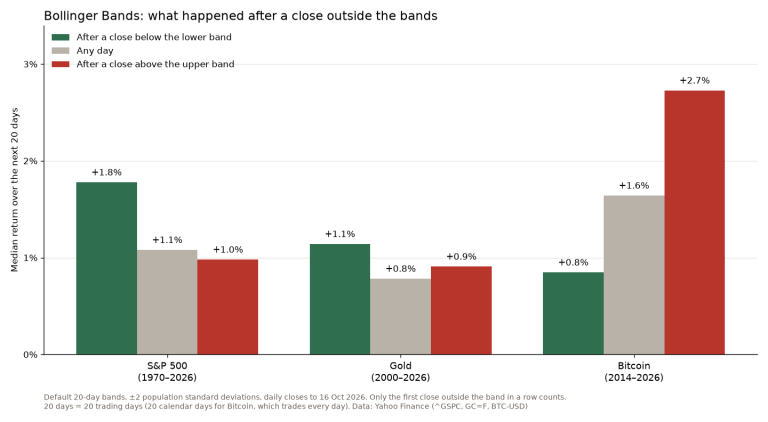
For a trader it’s a different question. Buying a short-term drop in a stock index has worked a little better than average. In my Bollinger Bands data, a close below the lower band on the S&P 500 was followed by a median 20-day return of +1.8%, against +1.1% after any day. But a trade needs an exit, and that’s where the stop loss comes in. The “7% rule” people ask about is William O’Neil’s: cut a stock that falls 7–8% below what you paid. It’s a rule for getting out of a dip that keeps dipping, not for buying one.
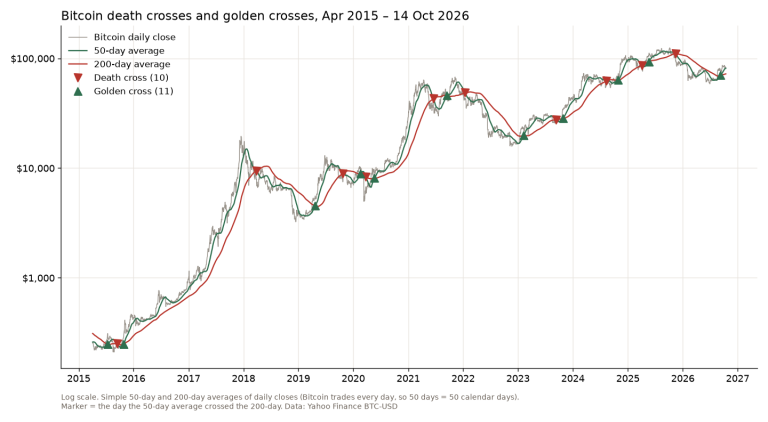
And if you buy the dip in a single stock or in Bitcoin, remember that an index always came back so far, and a single stock doesn’t have to. The same goes for a Bitcoin death cross: the falls that look like bargains are sometimes the start of the big one.
FAQ
Is buy the dip a good investment strategy?
Not for long-term money in the S&P 500. Since 1989, waiting for a 10% or 20% fall before investing ended behind investing every month in all 215 twenty-year periods I tested.
Is it better to buy the dip or dollar-cost average?
Investing every month did better than any dip rule you could actually follow. Only perfect knowledge of every bottom beat it in most 20-year periods, and even that lost over the full 38 years.
What is the 7% rule in stocks?
William O’Neil’s rule to sell a stock that falls 7–8% below your purchase price. It’s a stop loss for buyers, and I wrote about where to put a stop in stop loss trading.
The dip feels like the bargain. The months you spend waiting for it are the price.
Not financial advice. This is educational content, shared for information and entertainment only, and it is not a recommendation to buy or sell any asset. Backtests and past results do not guarantee future results, and the numbers or charts here may contain mistakes. Trading carries risk, including losing all the money you put in. Do your own research before you make any decision.