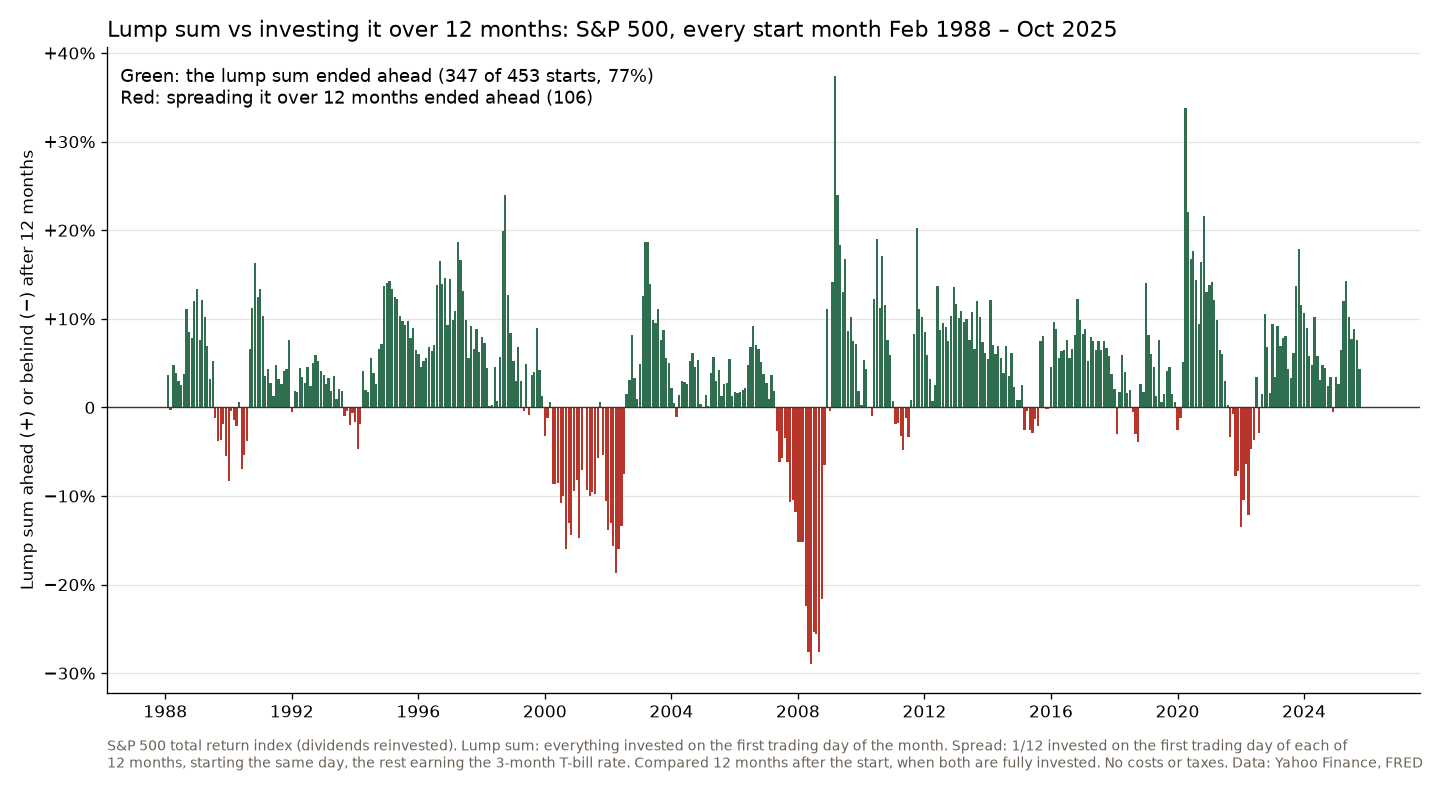
Dollar cost averaging means investing a sum in equal parts over several months instead of all at once. I tested both on the S&P 500 with dividends, for every start month from February 1988 to October 2025. Investing the lump sum at once ended ahead of spreading it over 12 months in 77% of the 453 starts, by a median of 4.5%. The longer the money was spread out, the more often the lump sum won. Dollar cost averaging won mostly when the start came just before a bear market.
Dollar cost averaging vs lump sum: what’s the difference?
Say you have $120,000 to invest, from an inheritance or the sale of a house. Lump sum investing puts all of it into the market today. Dollar cost averaging puts in $10,000 now and $10,000 at the start of each of the next 11 months, and the rest waits in cash. Either way you end up fully invested. The only question is what happens during the months in between.
This is not the same as putting part of your salary into an index fund every month. That money didn’t exist yet, so investing it when it arrives is simply investing it as soon as you can. The question here is about money you already have.
How I tested it
I used the S&P 500 total return index from Yahoo Finance, which includes dividends, with daily closes to 23 October 2026. Every test starts on the first trading day of a month, from February 1988 to October 2025: 453 starts.
- Lump sum: everything goes into the index on the start day.
- Dollar cost averaging: one twelfth goes in on the start day and one twelfth on the first trading day of each of the next 11 months. The waiting cash earns the 3-month T-bill rate (FRED data), which is fair to it.
I compare the two after 12 months, when both are fully invested. I also ran it with the money spread over 6 and 24 months. No costs and no taxes.
The results: lump sum won 77% of the time
| Spread over | Lump sum ahead | Median lead |
|---|---|---|
| 6 months | 70% | +2.1% |
| 12 months | 77% | +4.5% |
| 24 months | 83% | +9.1% |
The longer you spread the money, the worse it gets, because more of it sits in cash for longer while the market usually goes up. Over 12 months the lump sum came out ahead in 347 of the 453 starts.
One thing surprised me when I looked at longer periods. After the last monthly purchase, both portfolios hold exactly the same index, so the one that is ahead stays ahead by the same percentage forever. Ten years later the lump sum was still ahead in the same starts, by the same margin. The whole difference is decided in the months you spend getting invested.
When dollar cost averaging won
The red bars on the chart sit in clusters. Of the 106 starts where spreading the money won, 28 began in 2000–2002, 19 in 2007–2008 and 7 in 2022. Those are the starts that ran straight into a bear market. The worst one for the lump sum began on 2 June 2008: a year later it was 28.9% behind the spread-out investor. The best began on 2 March 2009, a week before the bottom, and the lump sum was 37.4% ahead.
When the lump sum won, it won by 7.2% on average. When it lost, it lost by 7.1%. So the size of the wins and losses was about the same. What differed was how often each happened, and the market’s habit of going up most years did the rest.
What Vanguard found
My numbers line up with Vanguard’s 2023 study by Megan Finlay and Josef Zorn. They used a global stock index from 1976 to 2022 and a shorter, three-month spread. The lump sum won 68% of the time. With T-bill interest on the waiting cash, as in my test, it still won 65% of the time. They make the same point about the end of the spreading period: from then on, the portfolio that is ahead stays ahead. They also found that spreading the money still beat leaving it all in cash, most of the time.
So which should you do?
If you can live with seeing the whole sum drop 20% a month after you invest it, the history says invest it now. Three times out of four that was the better choice, and the lead grew the longer the alternative took.
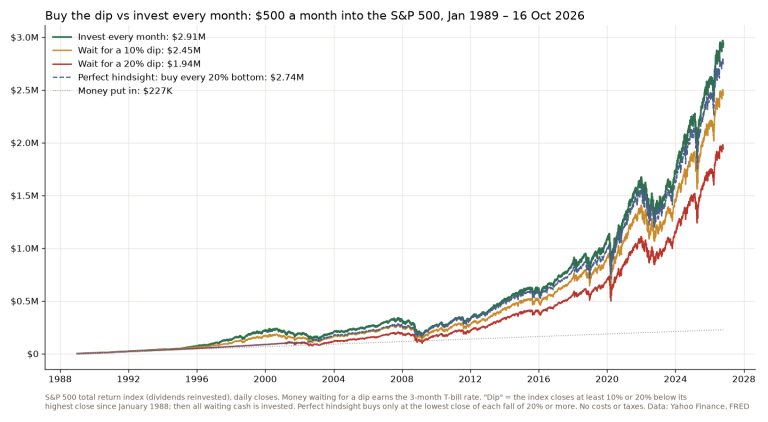
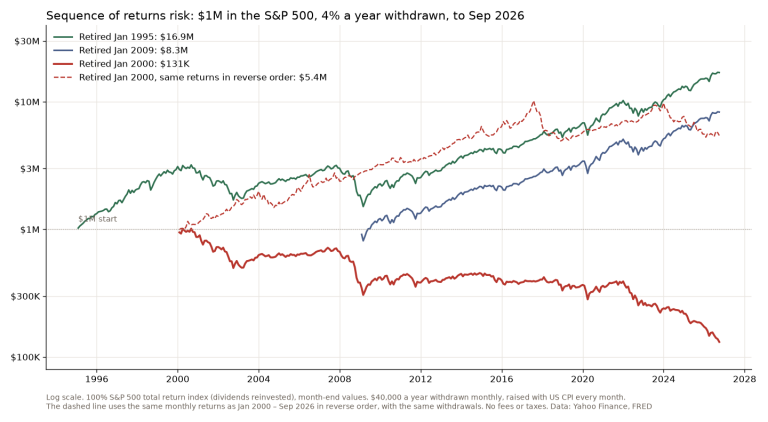
The case for dollar cost averaging is the one time in four when the lump sum goes in right before a crash, and what that does to you. If a bad start would make you sell near the bottom, spreading the money over a few months is a cheap insurance policy against your own reaction. Just keep it short: six months cost about half as much as twelve. What I wouldn’t do is wait for a dip first. I tested that too, and waiting for a 10% or 20% fall did worse than investing straight away in all 215 twenty-year periods I tested from 1989. If you are close to living off the money, the order of returns matters even more, which is the subject of my post on sequence of returns risk.
FAQ
Is it better to invest a lump sum or monthly?
With money you already have, a lump sum was better in 77% of the 12-month periods I tested on the S&P 500 since 1988. Monthly investing won mainly when the start came right before a bear market.
Is lump sum investing riskier?
For the first months, yes: all of your money is exposed at once. In the worst start, June 2008, the lump sum was 28.9% behind dollar cost averaging a year later. Over most periods that extra risk was paid for.
How long should you dollar cost average?
As short as you can stand. Spreading the money over 6 months, the lump sum won 70% of the time; over 12 months, 77%; over 24 months, 83%. Every extra month in cash cost a little more.
The lump sum usually wins. Dollar cost averaging is for the investor who would otherwise not invest at all.
Not financial advice. This is educational content, shared for information and entertainment only, and it is not a recommendation to buy or sell any asset. Backtests and past results do not guarantee future results, and the numbers or charts here may contain mistakes. Trading carries risk, including losing all the money you put in. Do your own research before you make any decision.