The risk reward ratio compares what a trade can lose, from the entry to the stop, with what it can make, from the entry to the target. Risk $1 to make $3 and you have a 1:3 risk/reward – or 3:1 reward to risk, the same trade written the other way round. On its own the number tells you nothing. A 3:1 trade that wins 20% of the time loses money, and a 1:1 trade that wins 60% of the time makes it. In my Setup Lab backtests the realized ratio ran from 0.15:1 to 6:1, and the test with the worst ratio had a 50% win rate.
What is a risk reward ratio?
It is the size of the possible loss next to the size of the possible gain. The risk is the distance from your entry to your stop loss, the reward is the distance from the entry to your target. Nothing more complicated than that – except that people write it both ways. WallStreetMojo puts the risk first, so risking $10 to make $20 is 1:2. Tradeciety divides the profit by the loss, so the same trade is 2:1, or just 2. In this post I use reward to risk, so a bigger number means more reward for every dollar at risk.
How to calculate the risk reward ratio
- Risk per share = entry price − stop price.
- Reward per share = target price − entry price.
- Reward to risk = reward ÷ risk.
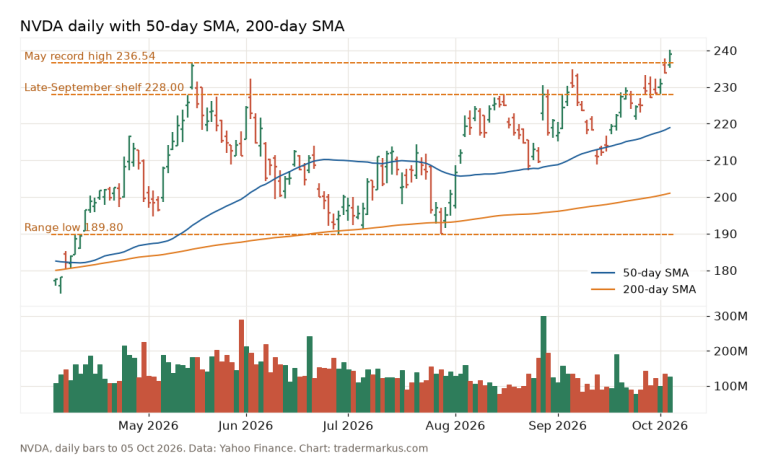
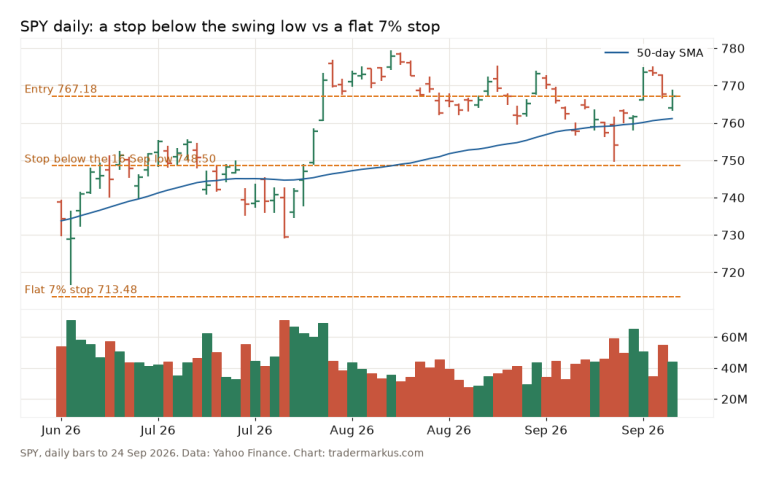
A worked example from my NVDA levels post, built on the 5 October close (the breakout failed four days later, but the arithmetic doesn’t care). Buying a pullback at $236.50 with the stop under the September shelf at $226.90 risks $9.60 a share. Up to the round $250 the trade makes $13.50 a share. $13.50 ÷ $9.60 = 1.4, so about 1.4:1 reward to risk, or 1:0.71 if you write the risk first. The ratio doesn’t tell you how many shares to buy; the stop does. With a $10,000 account and 1% risk per trade, $100 ÷ $9.60 is 10 shares. The full method is in my post on where to put a stop loss.
What win rate do you need to break even?
This is the part that makes the ratio useful. If the average winner is R times the average loser, the trades break even when the win rate is 1 ÷ (1 + R). Below that you lose money, above it you make money.
| Reward:risk | Break-even win rate |
|---|---|
| 0.5:1 | 66.7% |
| 1:1 | 50.0% |
| 1.5:1 | 40.0% |
| 2:1 | 33.3% |
| 3:1 | 25.0% |
| 5:1 | 16.7% |
That is before costs. Commissions, spreads and slippage come off every trade, so the real break-even sits a little higher, and it moves most for small targets, where the costs are a bigger share of the reward. This is also why “only take 3:1 trades” is half a rule. A 3:1 setup that wins one time in five loses money, while a 1:1 setup that wins 55% of the time doesn’t.
What my Setup Lab backtests show
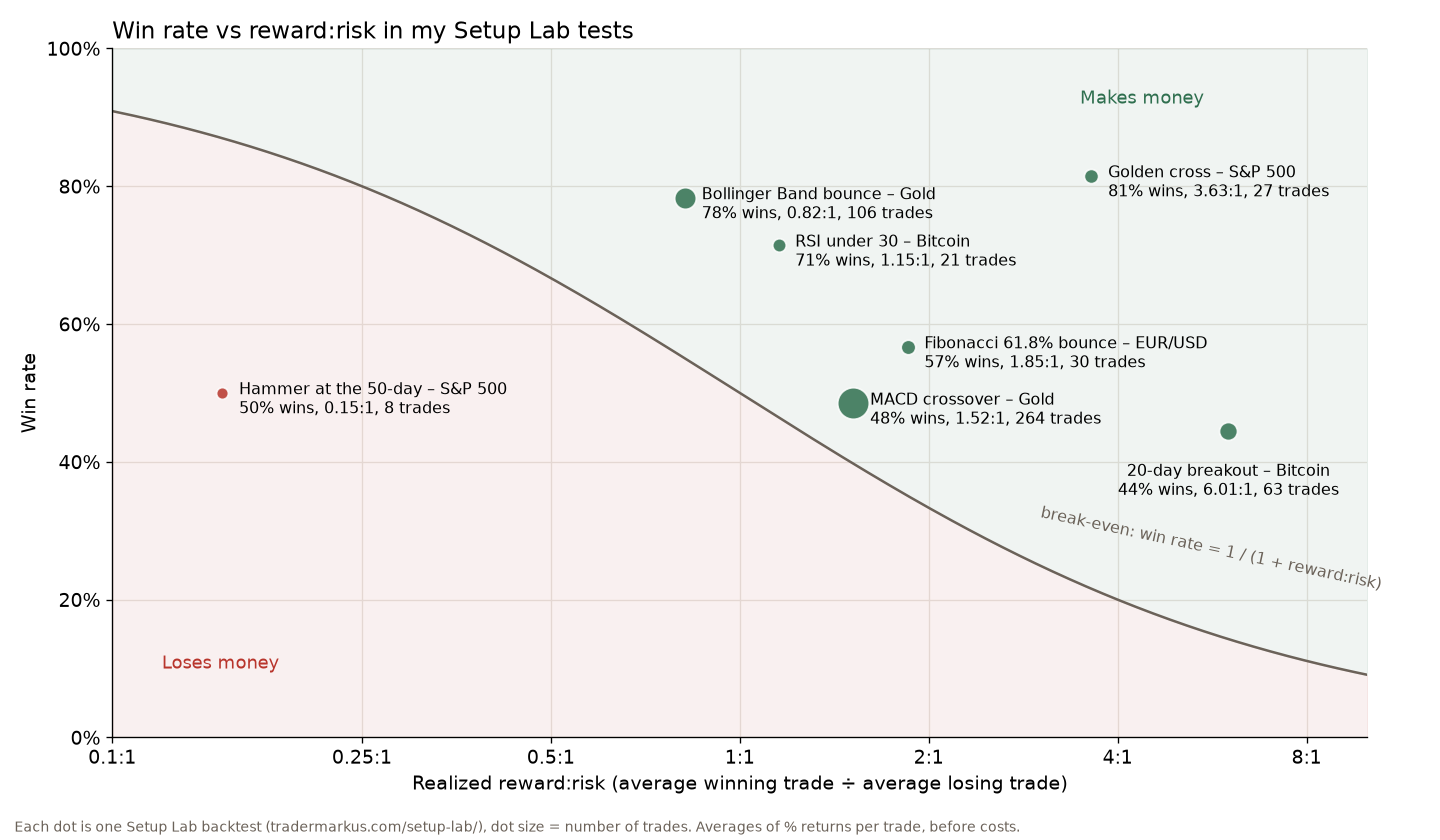
Every Setup Lab test reports both numbers, so I put them on one chart. The ratio here is the realized one: the average winning trade divided by the average losing trade, in percent per trade, before costs. The curve is the break-even line from the table. Below the chart, Won is the share of winning trades and Need is the break-even win rate for that ratio.
| Test | Won | Ratio | Need |
|---|---|---|---|
| Breakout Bitcoin |
44% | 6.0:1 | 14% |
| Golden cross S&P 500 |
81% | 3.6:1 | 22% |
| Fibonacci EUR/USD |
57% | 1.9:1 | 35% |
| MACD Gold |
48% | 1.5:1 | 40% |
| RSI < 30 Bitcoin |
71% | 1.2:1 | 47% |
| Bollinger Gold |
78% | 0.8:1 | 55% |
| Hammer S&P 500 |
50% | 0.15:1 | 87% |
The 20-day breakout on Bitcoin lost more often than it won and was still the best test by a distance. Its average winner made 39.7% and its average loser lost 6.6%, so it needed only 14% winners and had 44%. The RSI under 30 test is the opposite shape: 71% winners, but the average loser (−21.3%) was almost as big as the average winner (+24.6%). It cleared its 47% break-even comfortably, but a high win rate with big losers leaves less room than it looks. Setup Lab test 7, buying gold at the lower Bollinger Band, has the same shape on a smaller scale: 78% winners, but the average winner made 2.05% and the average loser lost 2.50%. That is 0.8:1, so it needed 55% winners. It had plenty to spare, about 1% per trade before costs. The MACD crossover on gold sat closest to the line: 48% winners against 40% needed, about half a percent per trade over 264 trades. That is a thin edge, the kind costs can eat.
Planned ratio vs realized ratio
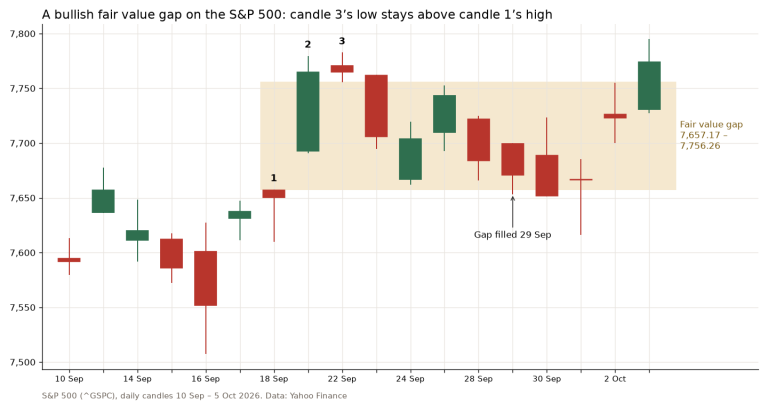
The hammer test is the one I’d show anyone who sets a 2:1 target and calls it done. Its rules had exactly that: the stop under the hammer’s low and a target at twice that distance above the close. Half the trades won. But the realized ratio was 0.15:1 – the average winner made 0.31% and the average loser lost 2.06%. Only two of the eight trades reached the target. In July 2017 the price was already most of the way there by the time the test bought (it trades at the next day’s close), so the win was 0.65% instead of the planned 2R. After the hammer of 18 September 2026 the next close was already above the target, and the trade ended flat. The other six hit the stop. Three of those still counted as small winners, because the next close happened to be a little above the entry. And the stop was not a wall: in October 2018 the market closed far below it before the test could sell, and that trade lost 5.3%.
Real trading does the same things to a plan. You get in late, or you take profits early because the trade feels good, and now and then the market gaps past the stop. So the ratio you draw on the chart before the trade is a hope. The one in your trade log after 30 or 50 trades is the fact. If you keep a trading journal, average winner ÷ average loser is the first number I’d calculate from it, next to the win rate.
What is a good risk reward ratio?
There isn’t one number. 2:1 and 3:1 are the usual advice, and they are fine as long as the chart actually offers them. What I don’t do is put the target at 3:1 because a rule says so when there is resistance halfway there. That doesn’t improve the trade; it just lowers the win rate. I take the stop and the target from the chart, see what ratio that gives, and then ask whether this kind of setup has won often enough to pay for it. A trend-following trade can live on 40% winners. A mean-reversion trade with a close target had better win most of the time.
FAQ
What does a 1.5 risk reward ratio mean?
Usually that the trade can make 1.5 times what it risks: risk $100, target $150. If someone writes it risk first (1:1.5), it is the same trade. At 1.5:1 you need to win 40% of the time to break even before costs.
What is a 3 to 1 risk reward ratio?
The target is three times as far from the entry as the stop. Risk $2 a share to make $6 a share. It breaks even at a 25% win rate, so it can be a good trade or a bad one depending on how often that kind of setup actually reaches the target.
Is a 1:1 risk reward ratio good?
Only with a win rate clearly above 50%, after costs. Plenty of short-term traders work at about 1:1 with a high win rate. The danger is that a few slipped stops turn 1:1 into something worse, and then 55% winners isn’t enough.
The risk reward ratio is half of a question. The other half is how often you win, and the answer to that is in your trade log, not on the chart. Work out both, and if they don’t add up to a profit, no target placement will fix it.
Not financial advice. This is educational content, shared for information and entertainment only, and it is not a recommendation to buy or sell any asset. Backtests and past results do not guarantee future results, and the numbers or charts here may contain mistakes. Trading carries risk, including losing all the money you put in. Do your own research before you make any decision.