Since QQQ started trading in March 1999, it returned 10.27% a year with dividends reinvested, against 8.24% for SPY. That turned $1 into $15.01 instead of $8.96. QQQ was ahead in 15 of the 17 ten-year stretches since. But it also fell 83% from March 2000 to October 2002 and didn’t get back to its old high until February 2015. You pay for the extra return with a much rougher ride.
Most QQQ vs SPY pages are comparison tools with a chart and a fee table. Here are the numbers that matter for a decision: how often each one won, how deep the falls were, and how long they took to recover.
What is the difference between QQQ and SPY?
SPY tracks the S&P 500, the 500 large US companies across every sector. QQQ tracks the Nasdaq-100, which, in Invesco’s words, “comprises the 100 largest non-financial companies traded on the Nasdaq”. No banks, and a much heavier weight in technology. QQQ’s total expense ratio is 0.18% a year, according to Invesco; SPY’s gross expense ratio is 0.0945%, according to State Street.
They overlap a lot. The daily returns of the two moved together with a correlation of 0.85 since 1999. The difference is in how far they move.
QQQ vs SPY: the returns since 1999
| Since Mar 1999 |
QQQ | SPY |
|---|---|---|
| Per year | +10.27% | +8.24% |
| $10,000 became | $150,071 | $89,607 |
| Yearly volatility | 26.9% | 19.2% |
| Worst fall | −83.0% | −55.2% |
| Years ahead (of 26) | 16 | 10 |
Dividends reinvested, Yahoo adjusted closes, 10 March 1999 to 19 November 2026. Calendar years 2000 to 2025.
QQQ’s best year against SPY was 2020, up 48.4% while SPY made 18.3%. Its worst was 2000, down 36.1% while SPY lost 9.7%. Over ten calendar years in a row, QQQ was ahead in 15 of 17 windows. The two where SPY won both started at the top of the dot-com bubble: 2000 to 2009 and 2001 to 2010.
The drawdown is the real difference
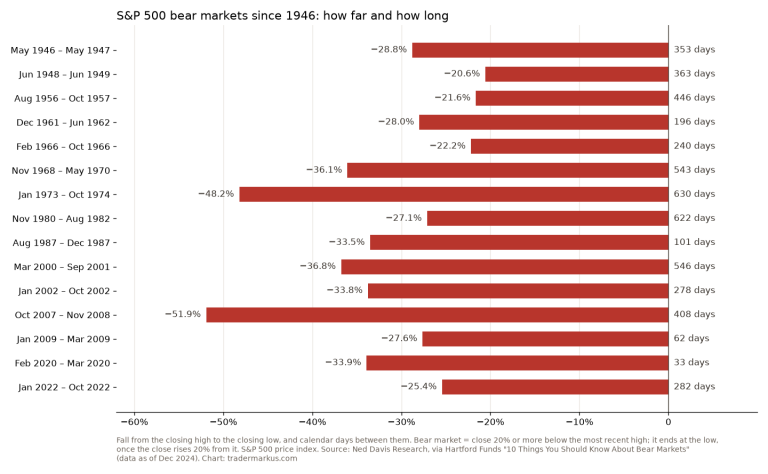
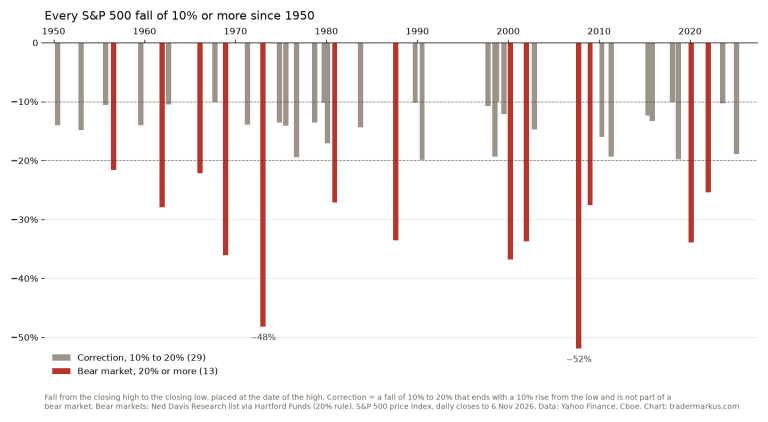
QQQ fell 83.0% from 27 March 2000 to 9 October 2002. Someone who bought at the top waited until 20 February 2015, almost 15 years, to be back where they started, with dividends included. SPY’s worst fall was 55.2%, from 9 October 2007 to 9 March 2009, and it was back above its old high on 16 August 2012.
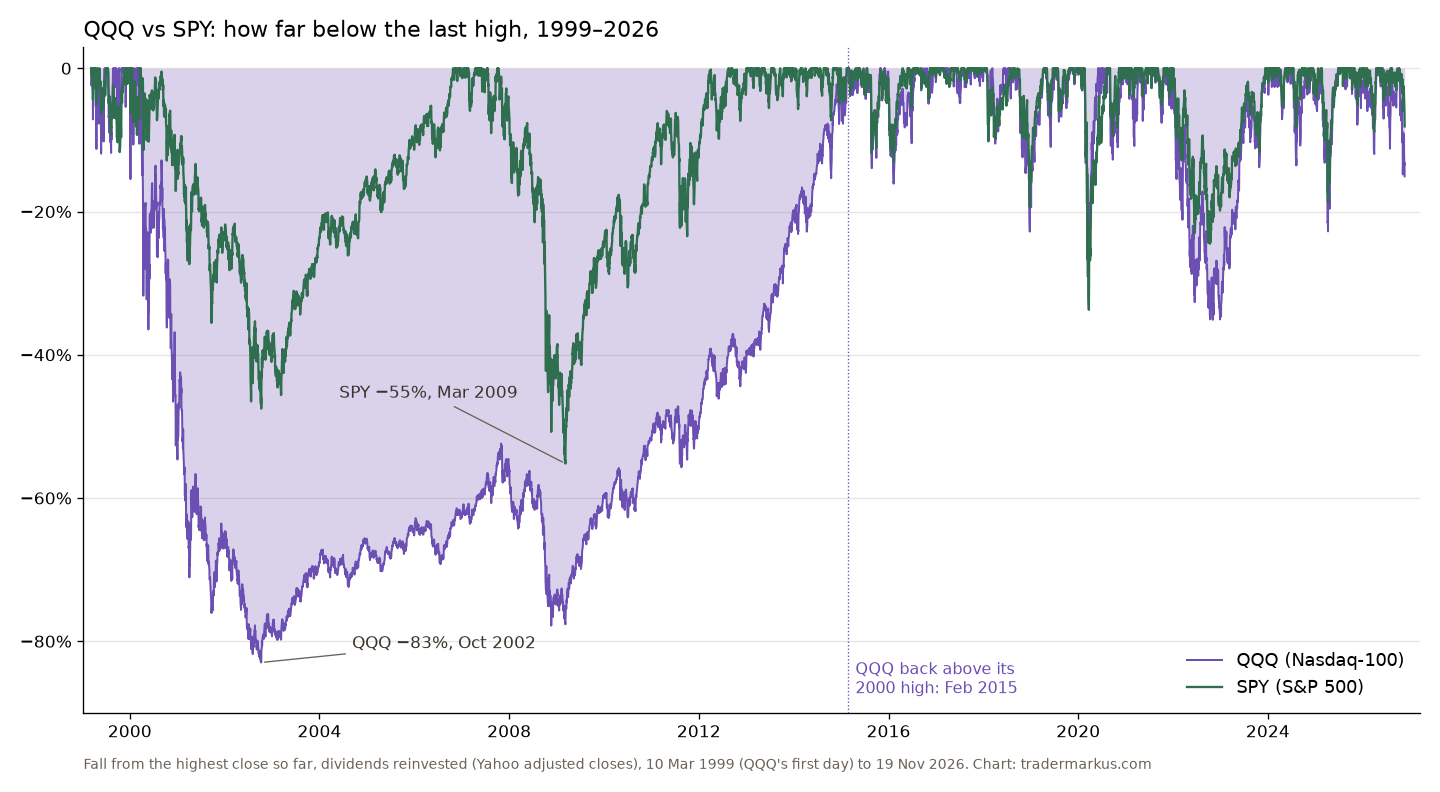
Since then the gap has been smaller but it hasn’t gone away: in 2022 QQQ fell 35.1% from its high, against 24.5% for SPY. The point isn’t that QQQ is a bad fund. It’s that the higher return came from owning a narrower, more volatile group of stocks, and the price of that is falls few people can sit through.
Nasdaq-100 vs S&P 500 before QQQ existed
The indexes go back further. From 1 October 1985 to 19 November 2026, the Nasdaq-100 gained 14.21% a year in price and the S&P 500 9.30%, both without dividends. The Nasdaq-100 was ahead in 27 of 40 calendar years, and in 1999 alone it rose 102.0% while the S&P 500 made 19.5%. That is the run QQQ was launched into.
2026 so far
Up to 19 November, QQQ was up 5.4% for the year and SPY 5.8%, both with dividends, so SPY was ahead in 2026 so far. Both set their record close on 6 October. Since then QQQ has fallen 15.1%, deep enough to count as a correction, and SPY 8.1%, on closing prices. It is the long-run pattern on a small scale: the Nasdaq-100 corrects about three times as often as the S&P 500.
What I take from it
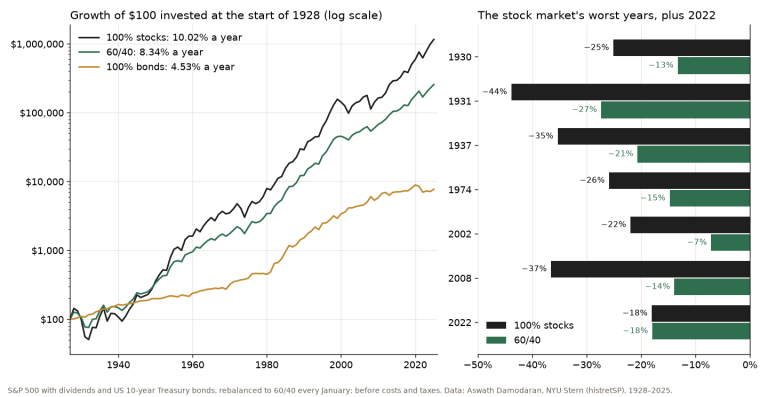
If you compare only the end points, QQQ wins and the decision looks easy. I’d look at the worst fall first. A position you sell in a panic at −60% never gets the 10.27% a year. So the real question is how much of a drop you can hold through, and the size of the position should come from that, not from the backtest. That is why I put max drawdown next to the return of anything I look at.
The long-run case for owning the whole market, cheaply, is in my review of Bogle’s Little Book of Common Sense Investing. QQQ is a bet on one slice of it. That slice has paid well, but it is a bet.
FAQ
Is it better to invest in SPY or QQQ?
QQQ has returned more since 1999, 10.27% a year against 8.24%, but with an 83% fall that took almost 15 years to recover. SPY is broader, cheaper to hold and has fallen less. Which is better depends on how much of a drop you can sit through.
Is it better to day trade SPY or QQQ?
QQQ moves more. Over the last 252 trading days to 19 November 2026, its average daily range from high to low was 1.48% of the close, against 1.00% for SPY. More movement means more opportunity and more risk per share, so the position size should be smaller in QQQ for the same risk.
What if I invested $10,000 in QQQ 10 years ago?
$10,000 in QQQ on 18 November 2016, with dividends reinvested, was worth $58,835 on 19 November 2026. The same amount in SPY became $38,364.
Not financial advice. This is educational content, shared for information and entertainment only, and it is not a recommendation to buy or sell any asset. Backtests and past results do not guarantee future results, and the numbers or charts here may contain mistakes. Trading carries risk, including losing all the money you put in. Do your own research before you make any decision.