Blog
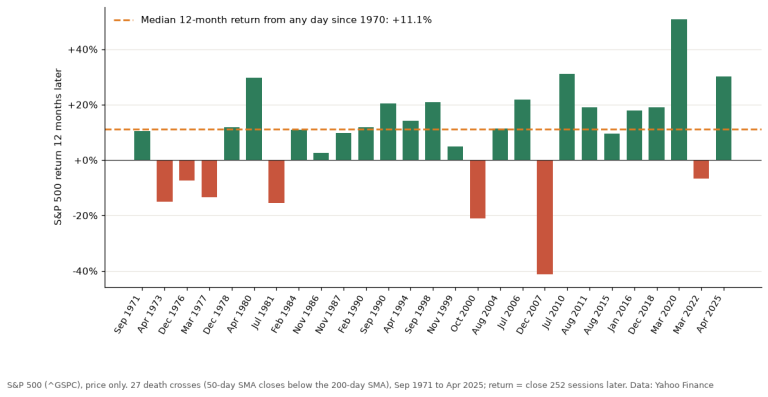
Death cross in stocks: What 27 S&P 500 signals since 1971 show
A death cross is when the 50-day moving average of a stock or index closes below its 200-day moving average. It sounds like the end of the world, and…
11 posts tagged indicators, newest first.
11 posts · page 2 of 2A death cross is when the 50-day moving average of a stock or index closes below its 200-day moving average. It sounds like the end of the world, and…
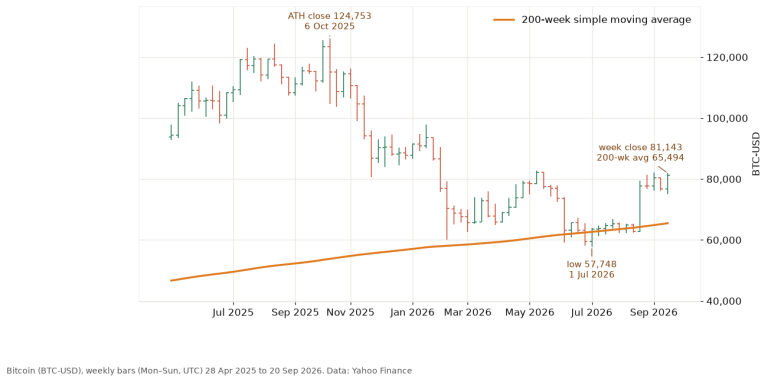
Bitcoin’s 200-week moving average is at about $66,800: the average of the last 200 weekly closes, up to the week that ended on 18 October 2026. That…
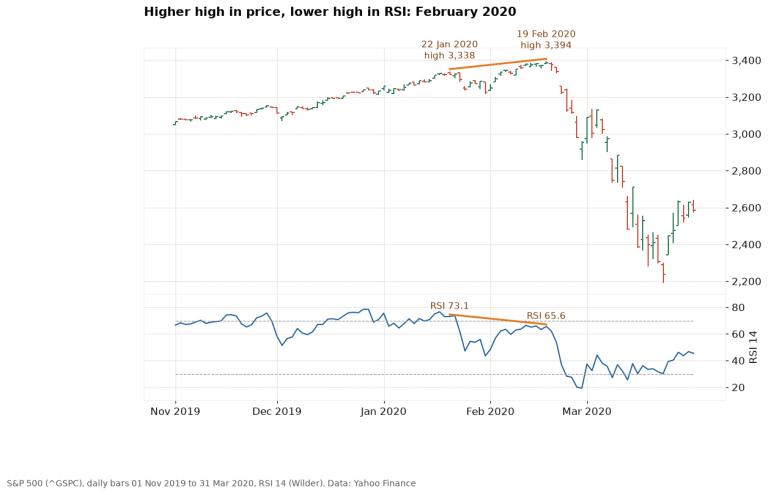
RSI divergence is when price and the Relative Strength Index disagree: price makes a higher high while RSI makes a lower high (bearish), or price…
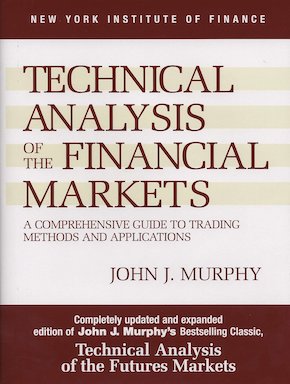
The book begins with trading cycles, time, volume, markets in general. Alan Farley writes about cross-market analysis, how markets react, correlate…
Probably a must read if you want to understand technical analysis, all the chart patterns, different indicators, charting etc. – this book is all…
Type a word or a book title. Titles, excerpts and tags are searched.