Blog
How to read stock charts: A step-by-step guide on a real chart
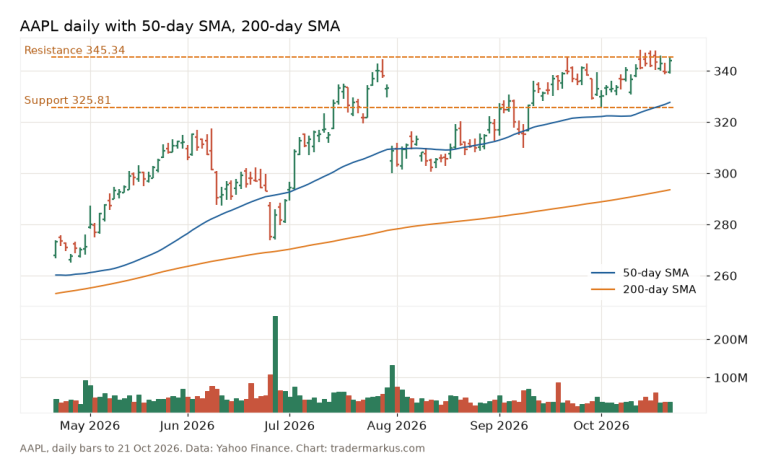
To read a stock chart, start with the time frame, then look at each bar’s open, high, low and close, then at the trend, the support and resistance…
31 posts tagged technical analysis, newest first.
31 posts · page 2 of 6To read a stock chart, start with the time frame, then look at each bar’s open, high, low and close, then at the trend, the support and resistance…
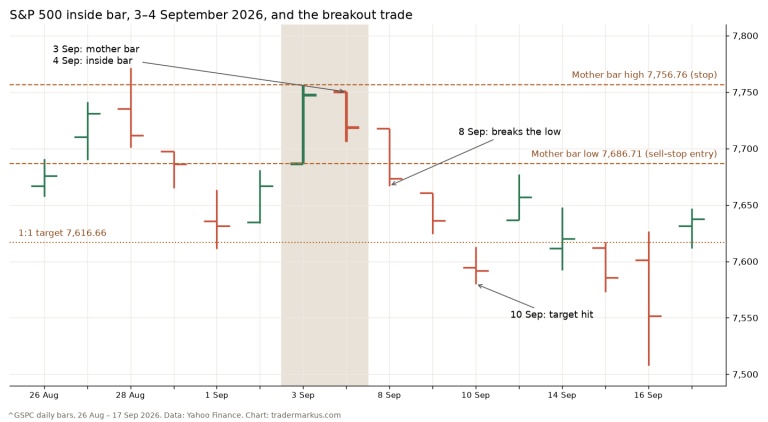
An inside bar is a bar whose high is lower and whose low is higher than the bar before it, so the whole day fits inside the previous one. Traders…
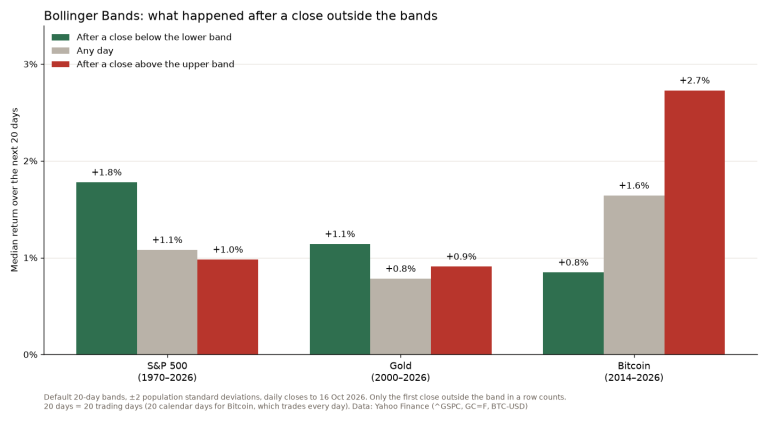
Bollinger Bands are a 20-day moving average with a band two standard deviations above and below it. I tested John Bollinger’s own rules on the S&P…
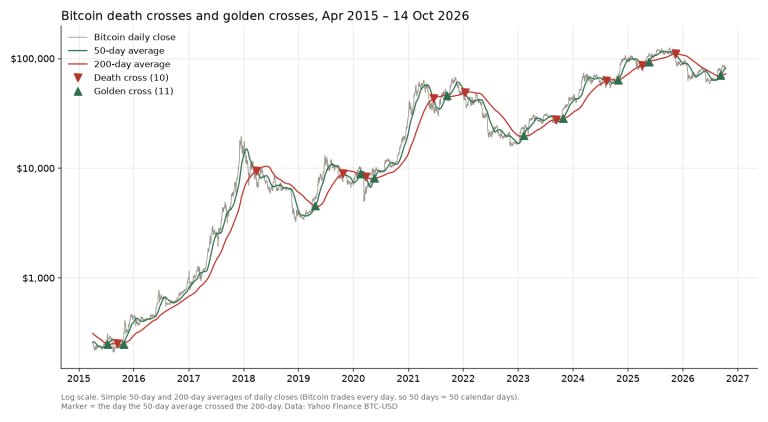
Bitcoin has had 10 death crosses since 2015, the days its 50-day moving average fell below the 200-day. A year later the price was higher after 5 of…
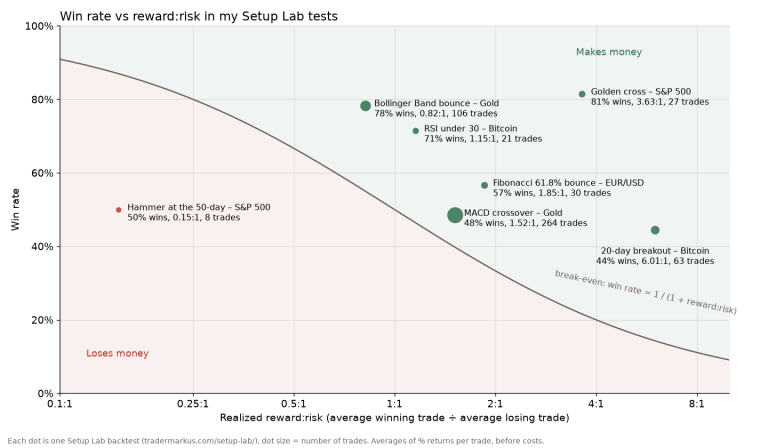
The risk reward ratio compares what a trade can lose, from the entry to the stop, with what it can make, from the entry to the target. Risk $1 to…
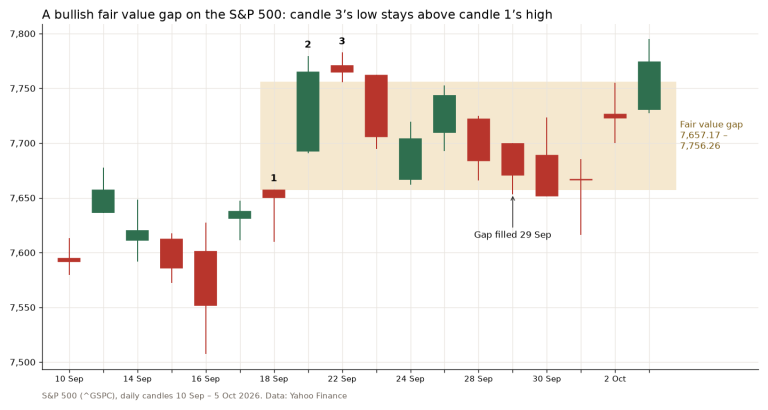
A fair value gap (FVG) is a three-candle pattern: the first candle’s high and the third candle’s low don’t overlap, and the empty space between them…
Type a word or a book title. Titles, excerpts and tags are searched.